Make it Stick: Mastering the Metrics and Strategies for SaaS Retention
SaaS companies live and die by their ability to retain customers - master the art of long-term loyalty with this data-driven guide to understanding and boosting your SaaS retention rates.

For any SaaS business, customer retention is critical to long-term success. But what exactly does "retention rate" mean for SaaS companies, and why does it matter so much?
I wrote this so we can all stop googling "retention rate saas" and finally have an answer. These are my compiled notes from years of research. Let's dig into how you improve your customer retention rates over time.
SaaS retention rate refers to the percentage of customers that continue to pay for your SaaS product or service over a specific time period. Typically it is calculated on a month-to-month or year-over-year basis. A higher retention rate means more of your customers are sticking around and continuing to generate recurring revenue.
There are two main reasons retention is so vital for SaaS:
- Recurring revenue
The SaaS business model relies on recurring subscription revenue, so retaining customers is essential for stable and predictable income. Losing customers means losing the recurring income those accounts provide every month or year. - Customer lifetime value
Loyal long-term customers have much higher lifetime value. The longer a customer stays, the more revenue you generate from that account over time. High retention maximizes customer LTV.
In short, retention directly impacts recurring revenue and customer LTV - two core drivers of SaaS success. That's why tracking and optimizing retention is a top priority. Benchmarking against industry averages, analyzing churn causes, and fostering engagement can all help improve retention.
This article provides a comprehensive guide to calculating SaaS retention rates, interpreting key metrics, and developing data-driven strategies to lock in customers for the long haul.
Key Customer Retention Metrics
To measure customer retention and track retention, SaaS companies rely on a handful of important metrics. These provide quantifiable insights into customer loyalty as well as revenue impact.
The four of the most critical retention KPIs are:
- Customer Churn Rate
- Customer Lifetime Value (LTV)
- Customer Retention Rate
- Expansion Revenue
Customer Churn Rate
This metric shows the percentage of customers that discontinue their subscription over a given time period. It is calculated by dividing churned customers by starting customers. A lower churn rate indicates higher retention. Best-in-class SaaS companies often have monthly churn under 1-2%.
Customer Lifetime Value (LTV)
This metric represents the total revenue a customer is expected to generate over their entire lifetime with your product. It factors in the average customer lifespan and revenue per account. Retaining customers longer directly increases LTV.
Customer Retention Rate
Expressed as a percentage, this shows the number of repeat customers in a given timeframe divided by total number of customers at the start of that timeframe. 85-90%+ retention is a strong benchmark for SaaS.
Expansion Revenue
As customers continue using your product, they may upgrade plans or purchase add-ons over time. Tracking this expansion revenue provides insights into customer loyalty and increased spending over their lifespan.
Monitoring these four metrics provides a 360-degree view of customer retention and its revenue impact. Later in this article we'll dive into strategies for optimizing each of these KPIs.
So what does good retention look like?
Retention is the most important metric for growing a successful, scalable business. But what exactly constitutes "good" versus "great" retention? In this post, we'll examine realistic retention benchmarks across different business models, using insights from growth experts and public data.
Defining Retention
Let's first define our terms: User retention refers to the percentage of users still active after 6 months. Active means they are using the product, making purchases, posting content, etc.
Revenue retention looks at monthly recurring revenue from a cohort of customers over time. It answers the question: How much more (or less) are you making from a group of customers compared to when they first signed up?
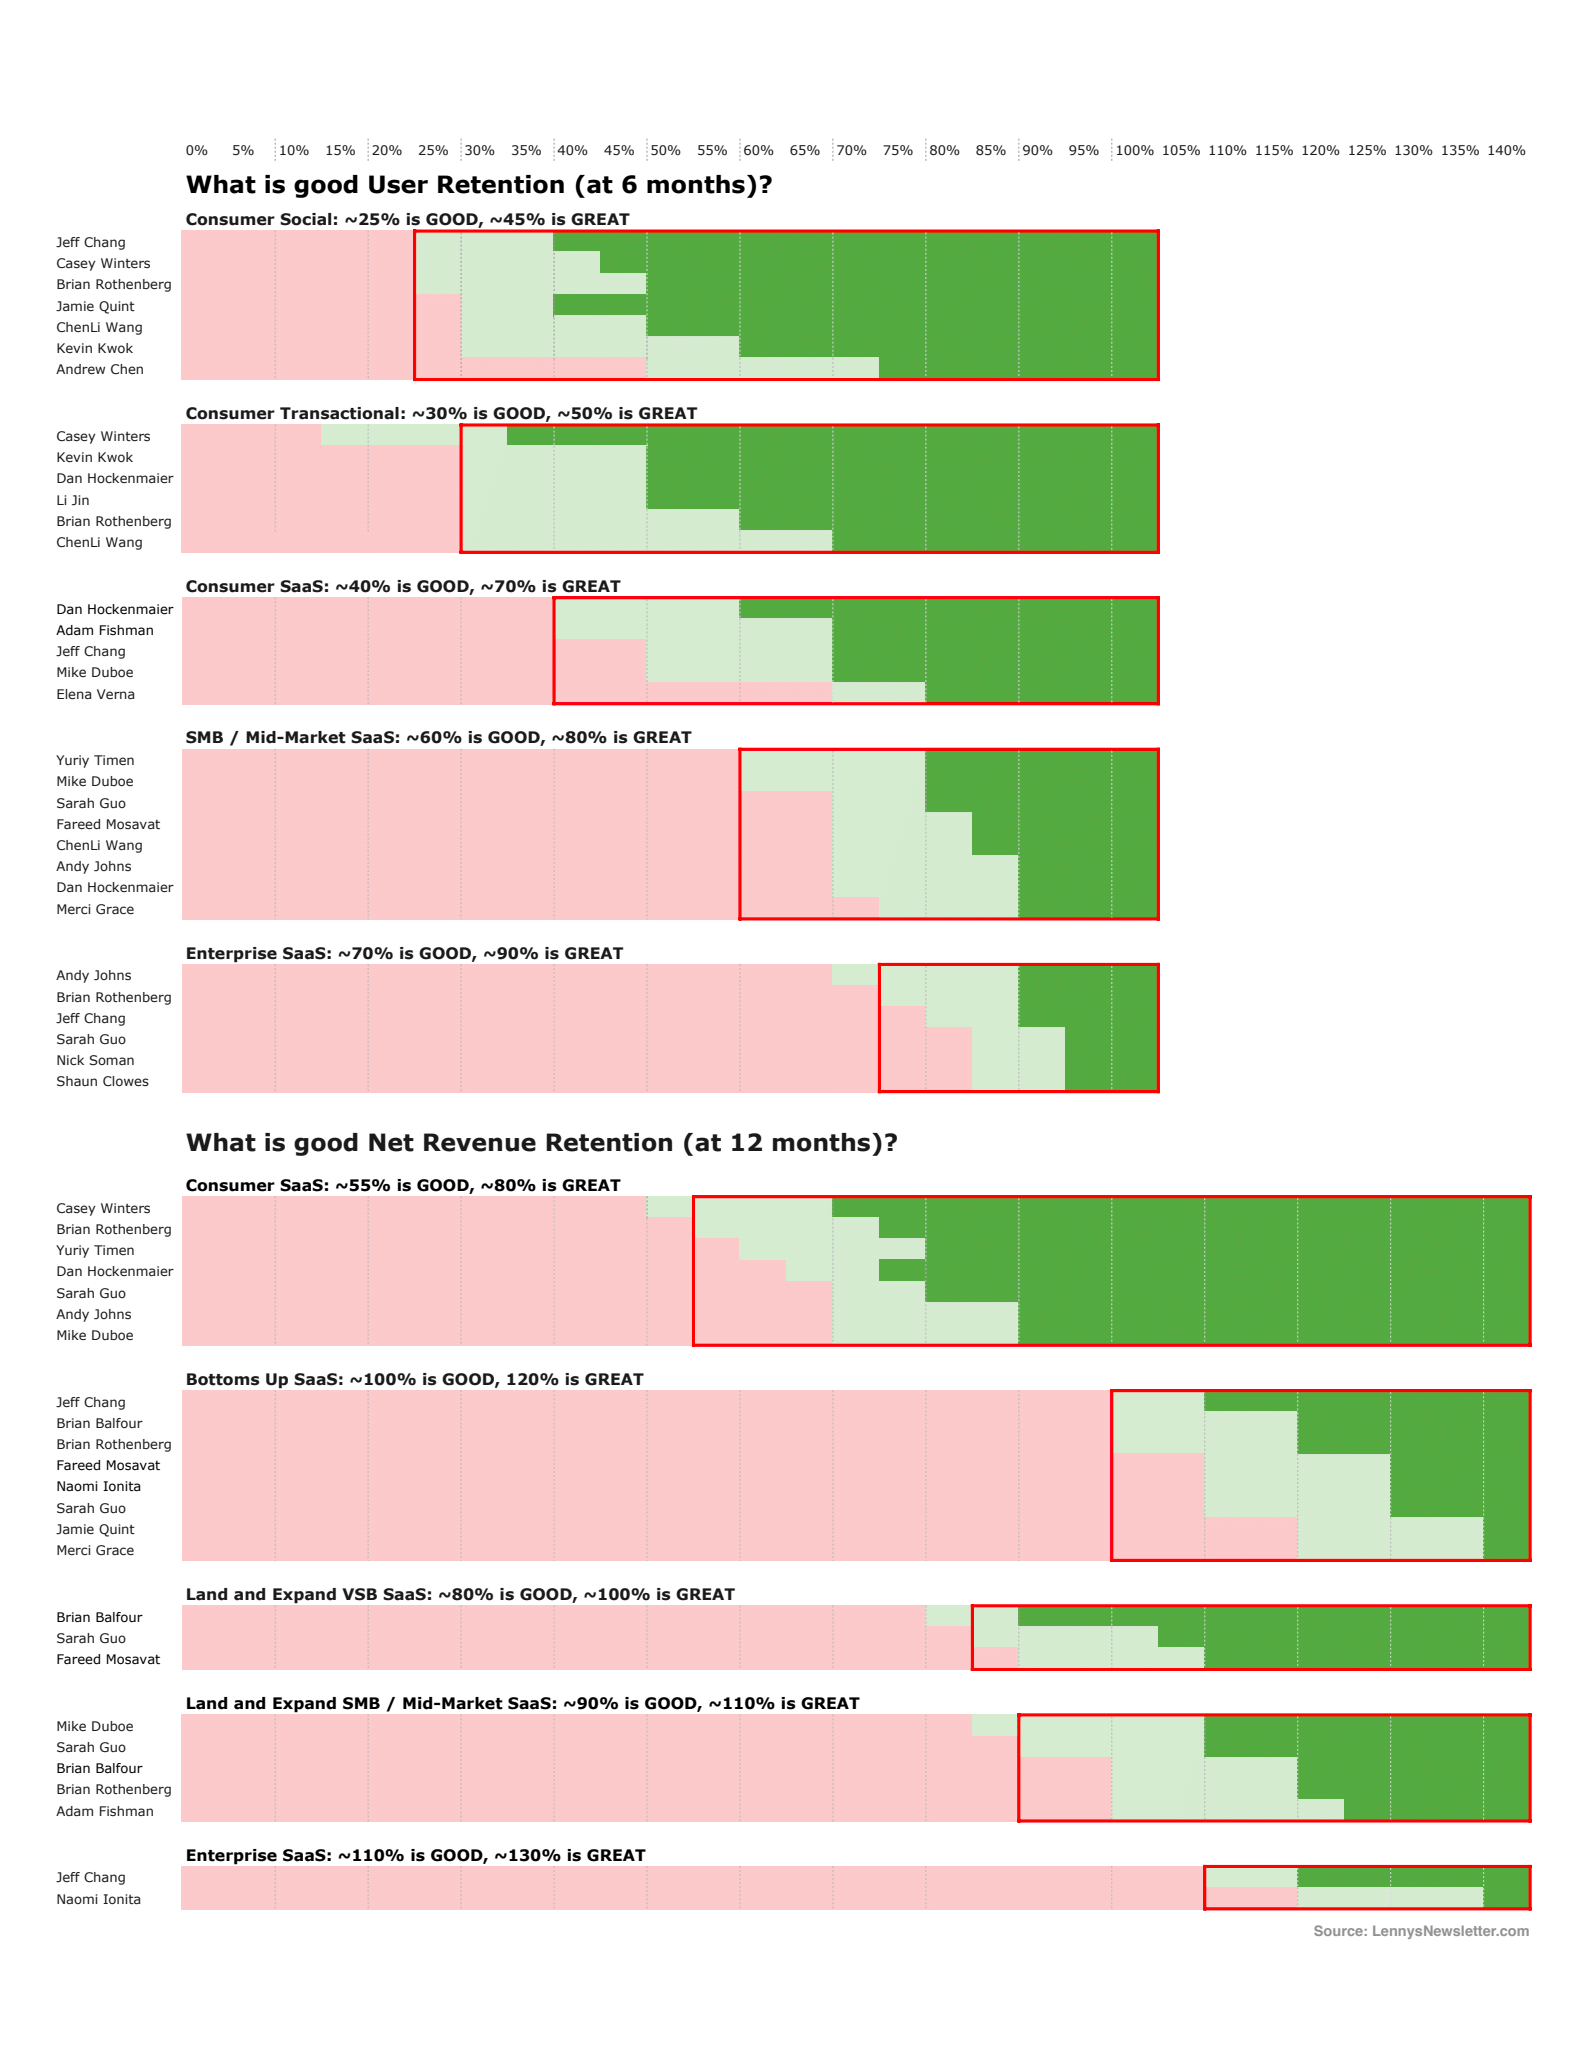
Benchmarks for User Retention
Now let's look at good and great user retention benchmarks by business model:
- Consumer Social (~25% good, ~45% great)
This includes ad-supported networks like Snapchat and Twitter. Facebook and Instagram actually have 60-70% 6-month retention, so around 45% is considered great for newer social apps. - Consumer Transactions (~30% good, ~50% great)
One-off transactional apps like Airbnb and Lyft have lower expectations. Retaining 30% of customers who have made at least one purchase after 6 months is decent. 50% would be exceptional. - Consumer SaaS (~40% good, ~70% great)
For subscription services like Netflix and Spotify, 40% 6-month retention is good, while best-in-class services like Amazon Prime boast over 90%. The range for great retention is around 70%. - SMB/Mid-Market SaaS (~60% good, ~80% great)
Products like Slack and Atlassian that target SMBs should aim for at least 60% 6-month customer retention. 80% would be excellent and match companies like Atlassian. - Enterprise SaaS (~75% good, ~90% great)
Finally, for products like Salesforce and Workday that sell to large enterprises, 75% retention at 6 months is good. The very best hit over 90% customer retention at 6 months.
Benchmarks for Net Revenue Retention
The cohorts are slightly different for net revenue retention (NRR):
- Consumer SaaS (~55% good, ~80% great)
NRR for Netflix and Spotify should stay above 55% year-over-year to be decent. 80% is exceptional. - Bottom-Up SaaS (~100% good, ~120% great)
Viral enterprise products like Slack and Zoom should have net revenue expansion, meaning NRR over 100% is good and 120%+ is amazing. - Land & Expand SaaS (~80-90% good, ~100-120%)
NRR benchmarks for land & expand models vary based on customer size. For ESB (Emerging Small Business, aka Startups) customers, 80% is good and 100% great. For SMBs/Mid-market, 90% is good and 120% is exceptional. - Enterprise SaaS (~110% good, ~130% great)
Finally, for enterprise SaaS companies, NRR over 110% is solid, with 130% being truly best-in-class.
Keep your product growing
High retention leads to sustainable growth. While these benchmarks provide targets to aim for, remember that retention must be balanced against factors like CAC. The right retention rate depends on your business model and unit economics. Use these guidelines to set realistic goals and prioritize improving retention.
Analyzing Customer Churn
Thoroughly analyzing customer churn is critically important for SaaS companies seeking to improve retention rates. Without understanding the underlying reasons and trends behind why customers cancel subscriptions, it is impossible to take targeted action to reduce churn.
There are three essential methods of churn analysis that provide actionable data:
- Cohort analysis tracks groups of customers over time to uncover trends, spikes, and patterns in cancellations. This granular data shows which customer segments have the highest churn risk.
- Customer surveys and interviews should be conducted immediately after cancellation to quantify the primary drivers of churn. This direct feedback measures the impact of factors like pricing, features, onboarding, and more.
- Industry benchmarking contextualizes a SaaS company's churn rates. Comparing to averages makes it clear if churn is higher than peers.
Together, these churn analysis techniques highlight significant opportunities to improve retention by revealing where, why, and which customers are at risk of canceling. The insights empower SaaS businesses to develop laser-focused initiatives to resolve churn pain points and control preventable losses. In other words, analysis is the crucial first step in retaining customers.
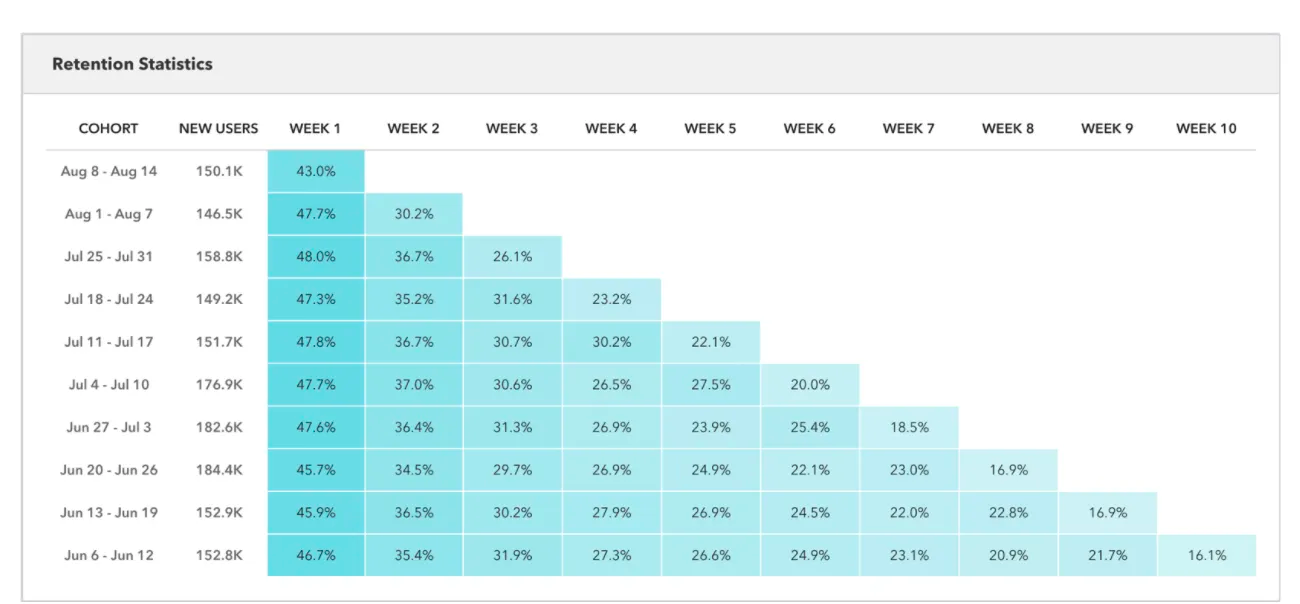
Cohort Analysis
Cohort analysis is a powerful technique for SaaS companies to identify trends and patterns in customer churn over time.
Cohorts are groups of customers defined by a shared trait, typically their initial signup date or acquisition channel. By dividing customers into cohorts based on when they first subscribed, you can track the retention rate for each cohort at set intervals going forward.
For example, you could analyze a cohort of users that signed up in January 2026 and follow their retention over 12 months. If 80% of this cohort is still active in January 2026, their 1-year retention is 80%. Doing this for each monthly cohort provides retention rate data over time.
This analysis quickly highlights any periods of excessive churn, such as a cohort with only 60% retention versus the average of 80%. You can then dig into potential causes, like releasing a buggy feature that month. Comparing cohorts also reveals the impact of process changes, marketing campaigns, feature releases, etc on longer-term retention.
To conduct cohort analysis, use a BI tool or spreadsheet to track and visualize retention for monthly or quarterly cohorts. Look for any outlier cohorts with excessive churn and form hypotheses for why. This granular data empowers you to pinpoint churn causes and address them.
Customer Research
Conducting direct customer research through surveys and interviews provides invaluable insights into the specific reasons and motivations behind churn. This qualitative data directly from customers should be a key part of any churn analysis.
You can get ahead of churn and drive retention by continually asking your customers three simple questions that gather:
- Product Gaps
Does the product have the features they need/want - Ease of Use
Is the product easy to use - Prioritized Feedback
What one thing can you do to make it better for them
You can keep this simple (yes/no, or Likert scale), or you can make it more complex. If you are losing customers, there's another method.
Ideally, you should survey customers immediately after they cancel or decide not to renew a subscription. This ensures you capture feedback while the experience is top of mind.
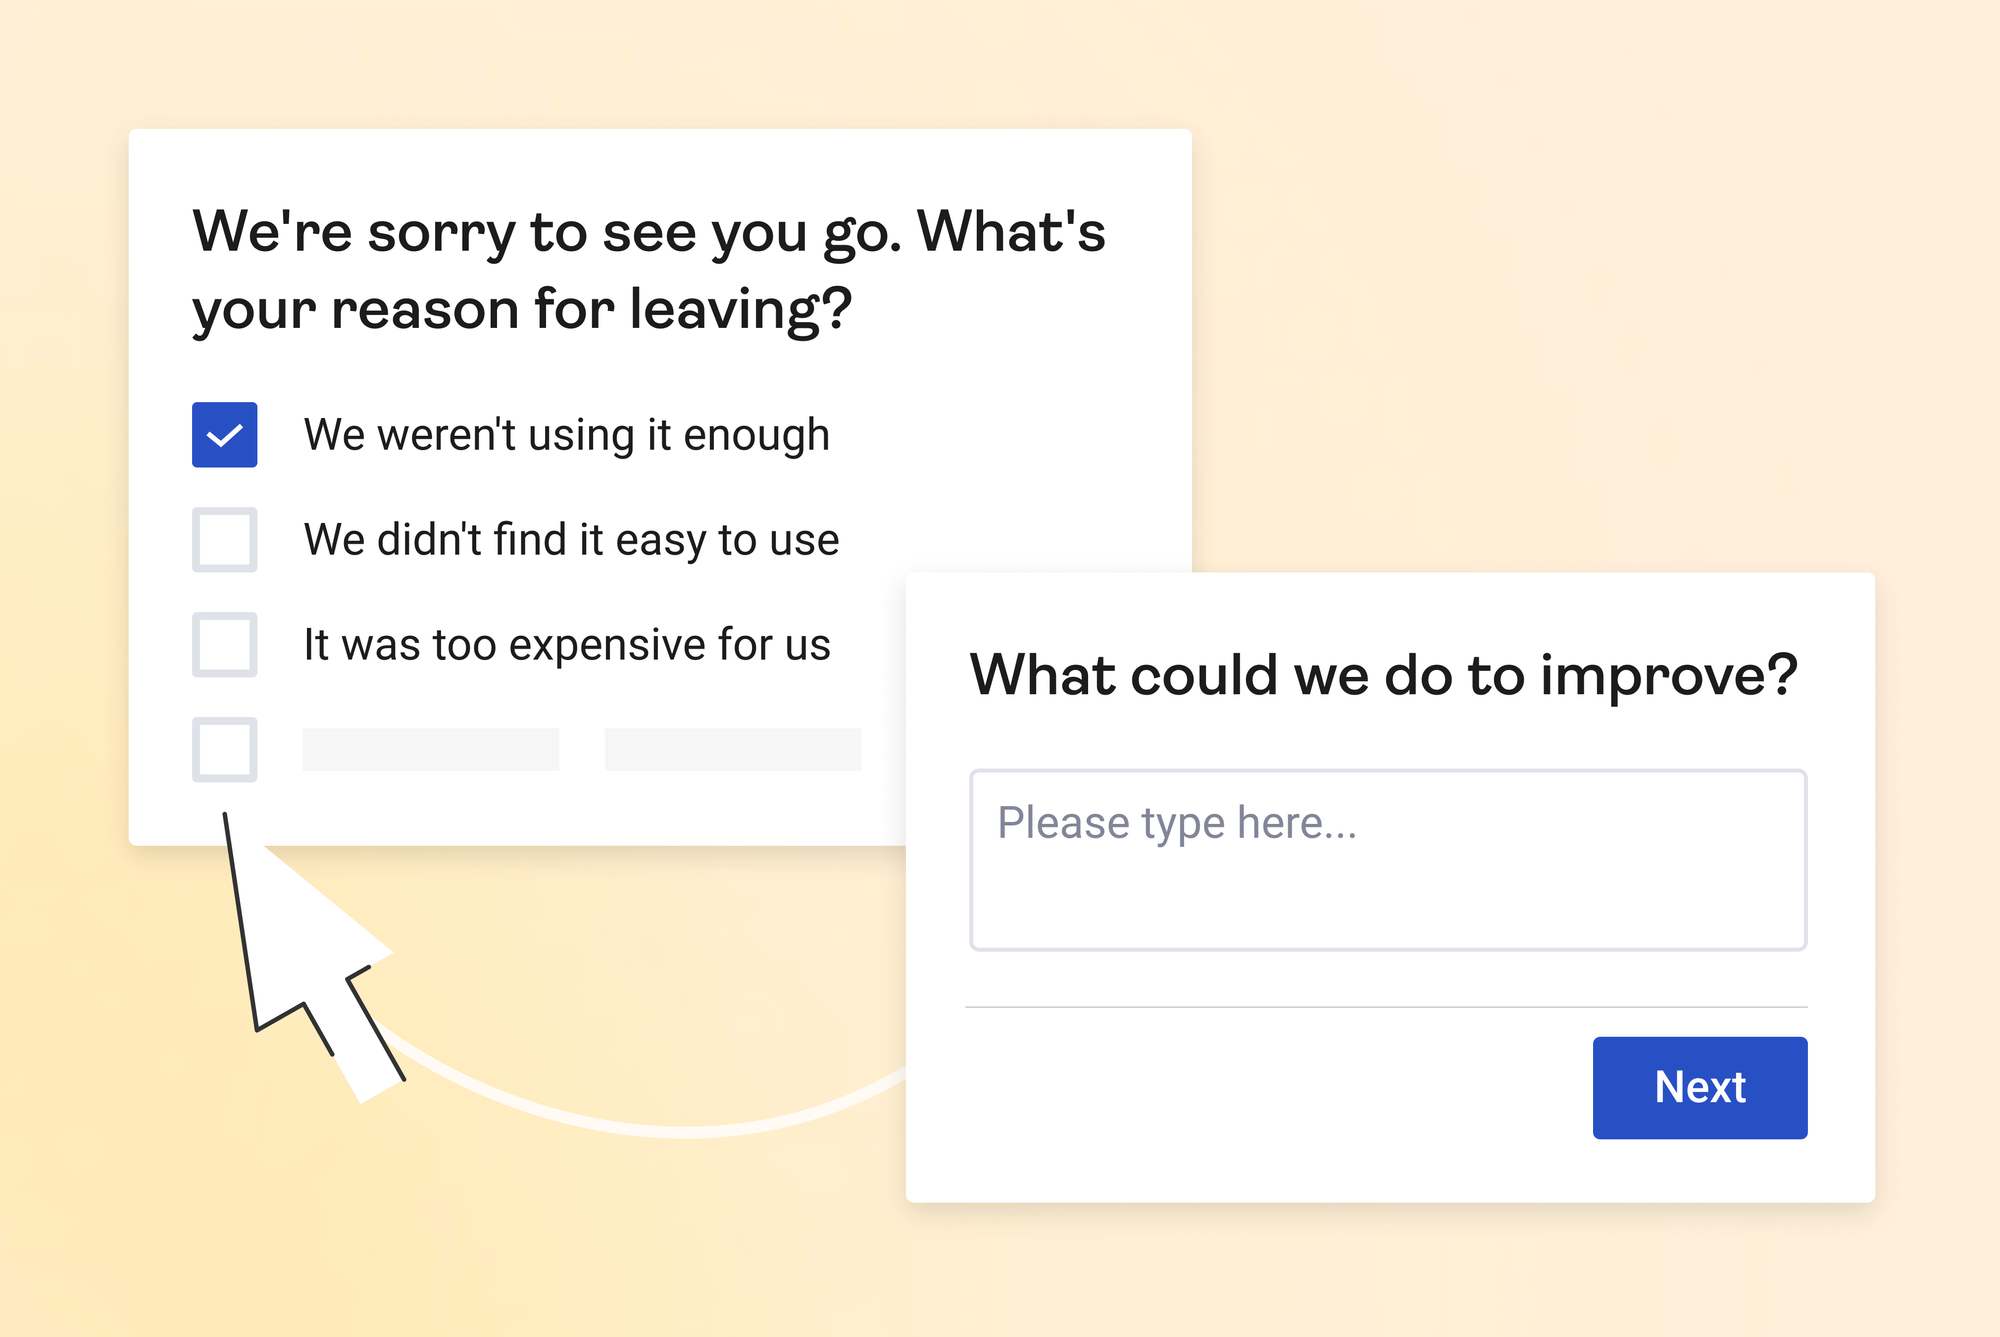
Survey questions should cover all potential drivers of churn, including:
- Pricing - Was the SaaS too expensive for their use case?
- Features - Were key features they needed missing from the product?
- Ease of use - Did they struggle with onboarding or find the UI/UX confusing?
- Value - Did they not receive expected value from the product?
- Customer support - Were support requests not handled efficiently?
- Competition - Did they switch to a competitive offering?
- Changing needs - Did their requirements or priorities change?
Quantify the percentage of customers citing each churn reason to focus your retention efforts on the biggest pain points.
Following up the surveys with phone interviews lets you probe deeper into common churn reasons. Listen closely for any recurring themes around lacking features, frustrations with the product, or areas for improvement.
Industry Benchmarking
No SaaS exists in a vacuum - benchmarking your churn rate against industry averages provides essential context on your performance.
The first step is identifying relevant benchmarks for your vertical, target customers, and business model. For example, an enterprise SaaS will be compared to different benchmarks than a consumer app.
Some potential sources for industry churn rate data include:
- Public SaaS companies
Many report their churn rates publicly in earnings reports and can serve as benchmarks. - Research firms
Gartner, IDC, and others publish churn rate data for major SaaS verticals in their market reports. - Surveys
Sites like Key Analytics and SaaS Scout survey hundreds of SaaS companies to compile anonymized industry churn benchmarks. - Similar competitors
If public/third-party data isn't available, you may be able to obtain informal benchmarking numbers through conversations with contacts at similar SaaS firms.
Once you've determined realistic benchmarks, compare your overall churn rate as well as cohort retention curves. This makes it clear if you are significantly above or below average. If your churn is much higher than peers, it should be elevated as a top priority to diagnose and address.
Regularly benchmarking against the industry provides context on your retention performance. Combined with cohort analysis and customer feedback, it paints a complete picture of churn root causes and opportunities.
Improving Retention Through Engagement
Retention is imply the outcome of engaged customers. Actively monitoring and boosting customer engagement provides a proactive way for SaaS companies to improve retention before churn ever happens.
Disengaged customers are at high risk of not renewing their subscriptions. By tracking engagement metrics, setting benchmarks, and re-engaging slipping users, you can nip potential churn in the bud.
Key engagement metrics like activation, sticky factor, and recency/frequency provide early warning signs of customers losing interest or struggling to gain value from your product. Analyze these metrics to identify common onboarding pain points and uses cases with repetitive friction.
Based on analysis of your most successful power users, set benchmarks for ideal customer engagement at key milestones like 30 days and 90 days post-signup. When customers dip below benchmarks, trigger campaigns to re-engage through email and in-product messaging. Offer training resources or support to get them back on track.
Proactively monitoring engagement allows you to detect dissatisfaction early and intervene before a customer decides to cancel. It also informs improvements to your onboarding, UX design, and customer education resources to prevent future disengagement. Retention rises when customers are engaged.
Tracking engagement metrics
Several core engagement metrics provide leading indicators of customer satisfaction and churn risk:
- Activation rate
This metric looks at the percentage of new signups who meaningfully engage with your product within the first week after onboarding. A high activation rate indicates your onboarding flow successfully gets customers up and running quickly. Low activation signals high early churn risk. - Sticky factor
Measures the frequency of product usage or login sessions. A high sticky factor means customers are using your product very habitually, which correlates to retention. Low sticky factor means the product is not becoming a habit for most users. - Recency/frequency
Analyze how recently customers have used your product, and how often they use it on a weekly/monthly basis. This helps identify customers falling out of regular usage that may be at higher risk of churn.
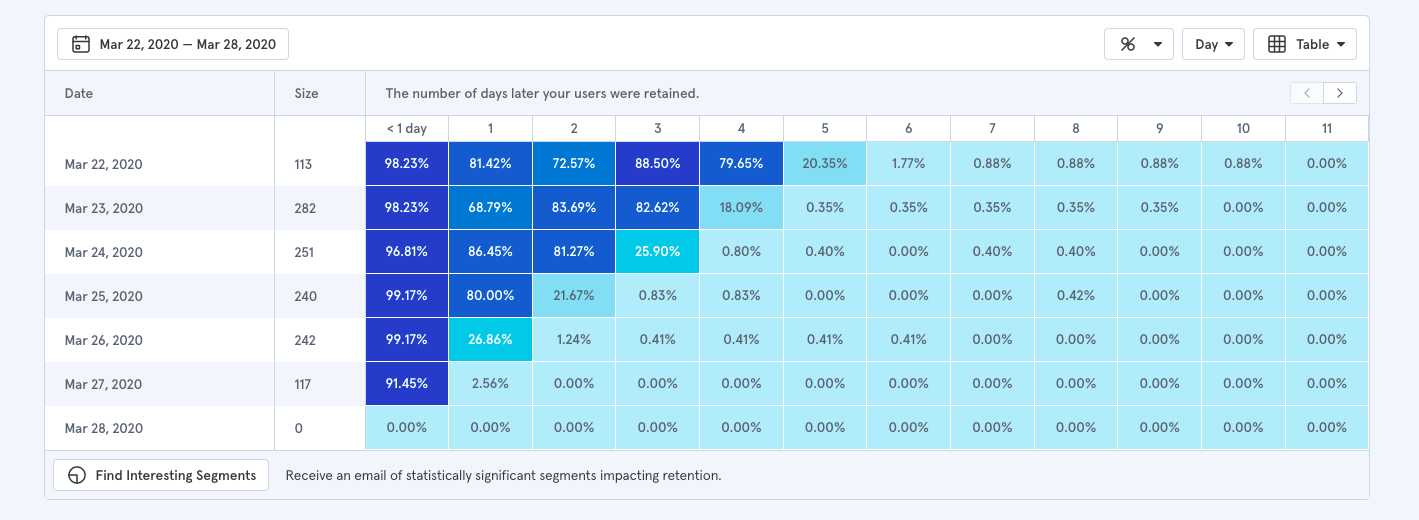
A customer intelligence platform is ideal for tracking these metrics across your user base. Look for patterns of specific personas or use cases associated with low engagement. Prioritize fixing pain points driving activation and engagement issues.
A platform like Amplitude is best for this:

Set engagement goals and benchmarks
In addition to tracking raw engagement metrics, SaaS companies should set clear goals and benchmarks for ideal customer engagement.
Analyze your most successful customer cohorts with high retention rates. Look at their activation rates, sticky factor, and usage frequency at 30, 90, and 180 day milestones.
Based on patterns of your best users, set engagement benchmarks for each milestone. For example:
- Activation rate of 50% within 7 days
- Sticky factor of 3+ sessions per week
- 80% of users active within past 7 days
Determine realistic engagement goals for your product and customers. The benchmarks should push you to optimize onboarding and continually drive engagement, but also be attainable.
Monitor user cohorts over time and segment by persona and acquisition channel. Identify groups consistently falling short of benchmarks. Dig into why and quickly address friction points or dissatisfaction.
Proactive monitoring against key benchmarks enables you to diagnose engagement issues early and improve experiences. This reduces preventable churn.
Identify disengaged users and re-engage them
Once you've set engagement benchmarks, systematically identify individual customers who are becoming disengaged and falling below expectations.
Here's what you should do next:
- Segment users by recency, frequency, activation rate, etc to surface at-risk accounts. Segment users by risk level based on how significantly they are underperforming on activation, sticky factor, and recency/frequency KPIs compared to benchmarks.
- Look for steep declines in usage and signs of losing habituation. These customers are highly prone to churn.
- Identify common attributes of disengaged accounts like persona, use case, or acquisition source. Look for patterns.
Now, with this segment of disengaged users, you can execute targeted campaigns to win back their engagement:
- Email campaigns with value reminders, new features, or special offers to incentivize re-engagement.
- In-app messaging to onboard them to new features or highlight product value.
- Webinars or training resources to help them gain skills and value from the product.
- Direct outreach for customer success team to diagnose issues and assist.
The goal is diagnosing why these specific users are disengaging and taking actions to actively win them back. Even small reactivation gains pay dividends in higher retention.
Calculating LTV and Revenue Retention
While all SaaS metrics provide value, customer lifetime value (LTV) and revenue retention rates are two of the most crucial numbers for modeling growth. These metrics quantify both customer loyalty and spending patterns over their entire relationship with your product.
LTV helps estimate projected revenue per account based on historical trends. Revenue retention formulas differentiate between recurring revenue from existing customers (gross) and expansion revenue from upgrades (net).
Together, these metrics provide actionable insights such as:
- Quantifying the revenue impact of churn over time
- Forecasting expansion potential from existing accounts
- Optimizing pricing and customer success for higher LTV
- Setting customer acquisition cost (CAC) targets based on LTV
Later in this article we will walk through the formulas for calculating LTV and both net and gross revenue retention in detail. We'll also look at how to determine your SaaS magic number as a ratio of LTV to CAC.
Monitoring changes in these metrics over customer cohorts illuminates the health of your business and where to focus efforts. When armed with accurate LTV and retention data, any SaaS can develop data-driven strategies for maximizing growth.
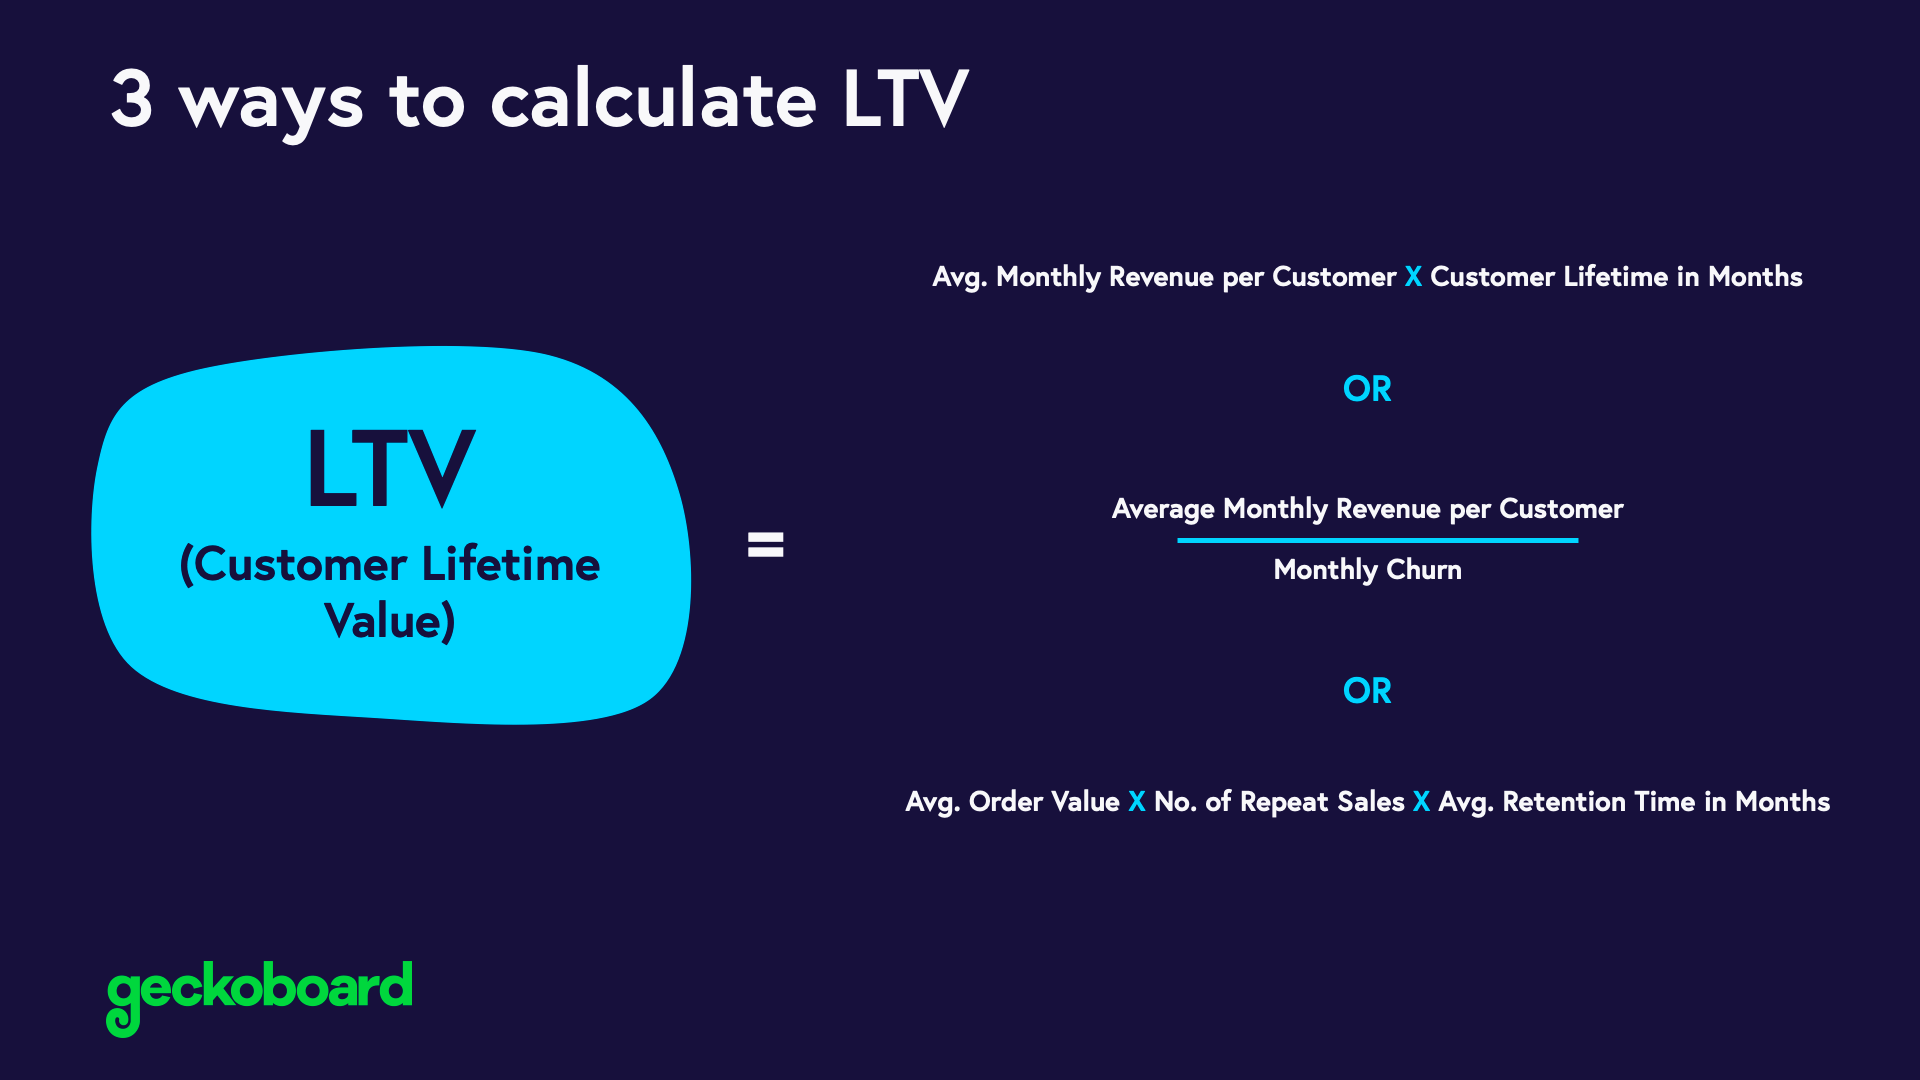
LTV Formula
The formula for calculating customer lifetime value (LTV) in SaaS is:
LTV = Gross Margin Per Account x Average Lifetime (in months or years) Let's break this down further.
Gross Margin Per Account:
- Calculate your average revenue per account (ARPA)
- Subtract your associated variable costs per account
- The remainder is gross margin
Average Lifetime:
- Take 1 divided by your overall account churn rate percentage
- This estimates how long the average account will remain active
For example:
With ARPA of $2,000, variable costs of $400, and a churn rate of 1% per month:
Gross Margin Per Account = $2,000 - $400 = $1,600
Average Lifetime = 1 / 0.01 = 100 months
LTV = $1,600 * 100 months = $160,000
The key for accuracy is segmentation - calculating LTV for your ideal customer persona or target market based on their ARPA and churn tendencies.
Net revenue retention (NRR) vs. gross revenue retention (GRR)
Gross revenue retention (GRR) looks exclusively at the recurring subscription revenue from an existing cohort of customers over a time period. It reveals retention without accounting for expansions.
Net revenue retention (NRR) incorporates expansion revenue like customers purchasing add-ons or upgrades. So NRR will equal or exceed GRR.
Monitoring both metrics paints a complete picture. GRR shows losses from churn while NRR shows growth from expansions. Comparing the two highlights opportunities to optimize pricing, packaging, and customer success for higher retention and expansion revenue.
Tracking changes in NRR and GRR over customer cohorts also provides an early indicator of issues lowering retention or adoption of new offerings. These metrics are critical for projecting revenue and tuning the levers of customer success for growth.
Gross revenue retention only looks at the recurring subscription revenue from the same cohort of customers over time. It does not include expansion revenue.
NRR = (Recurring Revenue from Existing Customers in Period 2 + Expansion Revenue from Existing Customers in Period 2) ÷ Recurring Revenue from Existing Customers in Period 1For example, if you started with 50 customers generating $100k in monthly recurring revenue (MRR), and after 12 months those same 50 customers were still paying $90k in MRR, your GRR is 90%.
GRR = Recurring Revenue from Existing Customers in Period 2 ÷ Recurring Revenue from Existing Customers in Period 1Net revenue retention also looks at expansion revenue from your existing customers like:
- Upgrades to higher pricing tiers
- Adding more licenses/seats
- Purchasing additional product modules or features
So if you again started with $100k MRR from 50 customers, but after 12 months...
- The same 50 customers now pay $85k in recurring fees (churn)
- Plus those customers generated $10k in expansion revenue
Your NRR is $85k (recurring) + $10k (expansion) = $95k/$100k = 95%
Because it includes expansion revenue, NRR will always be equal to or higher than GRR. The greater the expansion, the bigger the gap between NRR and GRR. High net retention demonstrates ability to upsell customers and increase spending over time.
SaaS Magic Number
For SaaS companies playing the long game, accurately measuring customer lifetime value (LTV) and retention is mandatory. These metrics reveal the true health and potential of your subscriber base well beyond vanity metrics like new signups.
In this section, we’ll dig into the precise formulas for calculating LTV based on gross margin, churn rate, and customer lifespan. You’ll learn the crucial difference between net revenue retention versus gross, and how to factor in expansion revenue.
We’ll also walk through how to determine your SaaS magic number – the key ratio comparing LTV to customer acquisition costs.
Magic Number = Customer Lifetime Value (LTV) / Customer Acquisition Cost (CAC)The magic number is a SaaS metric that evaluates the efficiency of customer acquisition costs (CAC) in relation to long-term customer value.
It is calculated by dividing customer lifetime value (LTV) by CAC. For example:
- Average LTV: $5,000
- Average CAC: $1,000
- Magic Number = LTV/CAC = $5,000/$1,000 = 5x
A magic number above 3x is typically considered strong, indicating your LTV is more than 3 times higher than acquisition costs. This results in profitable growth.
Magic number benchmarks:
- 0.5-1x
CAC is almost equal or higher than LTV - unlikely to be profitable - 1-3x
CAC is lower than LTV but barely covers costs of acquisition - 3x+
Strong indicator of efficient spending on acquisition - 5x+
Very high magic number indicative of optimizing CAC and maximizing LTV
Regularly calculating your magic number based on current LTV and CAC metrics lets you tune your growth engine for profitability. Improving activation, retention, and expansion all positively increase LTV and the magic number benchmark.
Mastering these metrics provides a dashboard for data-driven decisions to optimize pricing, packaging, promotions, and the entire customer journey for higher retention and lower unit costs.
The outputs power everything from projecting growth to maximizing subscriber value. Let’s dive in to the nuts and bolts of LTV and retention, and how getting these numbers right fuels the flywheel for any SaaS.
Turning Data into Goals: Setting Realistic Retention Targets
Understanding your current retention metrics is just the first step. The key is then setting clear goals and benchmarks to improve retention over time.
Retention rate targets should be based on thorough analysis of churn drivers, customer research, and relevant external benchmarks. While there are general industry standards, each SaaS must account for its unique business model, target customers, and product life cycle stage when goal setting.
In this section, we’ll overview typical SaaS retention benchmarks and how they vary across verticals, cohorts, and company maturity. We’ll provide a framework for diagnosing your unique churn risks and weak points before establishing retention goals. Finally, we’ll discuss proven initiatives for incrementally boosting subscriber loyalty.
With thoughtful analysis and realistic, incremental targets, any SaaS can improve retention rates and subsequent revenue stability. As retention improves, SaaS valuations and growth trajectory follow suit. Let’s turn retention data into action.
Typical SaaS Retention Benchmarks
While specific targets depend on your product and industry, some general benchmarks by vertical are:
- Enterprise SaaS - 85-95%+ annual retention
- SMB/Mid-Market SaaS - 70-85% annual retention
- Consumer Apps - 30-60% monthly retention
- Media/Content Sites - 45-80% monthly retention
Newer and smaller SaaS firms will trend to the lower end of ranges, while the best-in-class companies with loyal users achieve the higher retention benchmarks.
Setting Realistic Goals
When setting targets, take into account:
- Your current retention rates
- Trends from cohort analysis
- Primary churn drivers per research
- Life cycle stage of product and customer relationships
Right-size goals to be ambitious yet achievable based on where your business is now. Retention gains often follow an S-curve, with incremental improvements getting harder at higher benchmarks.
Improving Over Time
Some proven tactics to steadily boost retention include:
- Improved onboarding and in-app education
- Strong customer success team engagement
- Loyalty programs or memberships
- Additional value-driving features
- Pricing or packaging optimizations
- Increased marketing to high-LTV segments
Measure impact over 90-180 days and expand initiatives that demonstrably move the needle. Small but continuous gains add up over time.
Retention as the Cornerstone of SaaS Success
Throughout this guide, we've explored the critical importance of retention for SaaS businesses. When you can consistently retain and expand your subscriber base month-to-month and year-over-year, it unlocks sustainable growth and predictable revenue.
By proactively monitoring and optimizing retention, you maximize customer lifetime value while controlling churn and missed expansion opportunities. The metrics and analysis we've covered provide the blueprint.
Let's recap the key takeaways:
- Track retention KPIs - Churn, LTV, NRR - across cohorts to spot trends
- Dig into churn drivers with surveys, interviews, and benchmarking comparisons
- Monitor leading engagement indicators to prevent at-risk churn
- Calculate LTV and magic number to optimize growth levers
- Set retention targets based on data-driven insights and business model
- Test initiatives to incrementally improve retention over time
Retention efforts often go under-prioritized compared to new customer acquisition. But for SaaS, a loyal customer base is the most valuable asset.
With the frameworks and best practices covered in this guide, any SaaS now has the tools needed to diagnose churn, boost engagement, maximize LTV, and turn subscribers into customers for life.
The long-term gains will speak for themselves.
Recommended Reading
 Stephen M. Walker II