The B2B SaaS Playbook: Product Strategy & Metrics
Successful B2B SaaS startups should measure their strategy with key metrics in order to ensure that they are growing efficiently and have healthy gross margins. Key metrics for B2B SaaS companies include burn multiple, hype ratio, lifetime value, and user engagement.

A winning B2B Saas product strategy is one where the product is easy to use and meets the customer's needs while also being profitable for the company. Therefore, it is essential to research the market and understand the customer's needs before developing a product. Additionally, strong marketing and sales strategy are necessary to ensure that the product is successful.
The most crucial objective for B2B SaaS founders is early category leadership: they must define their category and then use social proof (via customers) to prove category validity to achieve this. Once the category is accepted, the sale switches from an evangelical sale to order-taking. When big companies enter the category, it validates the category leadership.
B2B SaaS companies should measure their metrics to ensure that they are growing efficiently and have healthy gross margins. Key metrics include burn multiple, hype ratio, lifetime value, and user engagement.
Overall there are six categories of metrics which are important for triangulating the health and success of the business and product:
- Trials – how well you convert awareness and traffic to early product usage
- Product Engagement – the best indicator for interest and usefulness
- Sales Efficiency – the best indicator of sustainable growth
- Margins – the best indicator of cash flow for market expansion
- Revenue Growth – your best indicator for product-market fit
- Revenue Retention – your best indicator for expansion (seats, use cases)
Freemium and Trials
The average B2B SaaS trial length is two to four weeks because it creates urgency for the sales process, allows the product to put its best foot forward, and measures the results within a defined period.
The Freemium model is better for viral or networked products that encourage user-generated content, network effects, or bottom-up adoption. In comparison, the Free Trial model is better for products that sell through lead gen via paid marketing and where buyers are different from free users.
Product Engagement
User engagement is a measure of how interested users are in a product. Engagement is essential for SaaS startups, as engaged users are more likely to convert to paid accounts and less likely to churn.
Measuring SaaS engagement is more complicated than measuring consumer engagement. You need to adjust for the effect of weekends and holidays, separate customer engagement from user engagement, and look at customer engagement for top accounts.
The best way to measure engagement is to look at DAU/WAU and DAU/MAU. A good target for a B2B SaaS product is a DAU/WAU that peaks at about 60% and a DAU/MAU that peaks at about 40%. This engagement pattern means that the typical weekly user visits the site 3 out of 5 weekdays, or at least two weekdays per week over a month.
Deep dive product engagement and building a quantitative models in these two articles:


Sales Efficiency
Sales efficiency is important to analyze to ensure that growth is efficient and sustainable. Leaders can use several related metrics to understand sales efficiency by comparing the value of new customers to the cost of acquiring them.
Ideally, you want new Sales ARR to be greater than or equal to Sales and Marketing spend, and Average Account Value (ACV) is greater than Customer Acquisition Cost (CAC).
Margins & Capital Efficiency
The Burn Multiple is a measure of how efficiently a startup is growing. It is an annualized version of the Hype Ratio calculated by dividing net burn by net new ARR.
The higher the Burn Multiple, the more cash the startup is burning to achieve each unit of revenue growth. The lower the Burn Multiple, the more capital efficient the company growth is. So the question to answer is: how much is the startup burning to generate each incremental dollar of ARR?
For venture-stage startups, a Burn Multiple of 2 or less is reasonable. Gross Margin should be > 75%, LTV should grow to at least 3x original CAC over time.
Measuring Revenue Growth
Revenue growth is the best proof of product-market fit for a B2B SaaS business – it demonstrates that you are solving a painful enough problem that people are willing to pay to solve it.
To measure revenue growth, use a Compound Annual Growth Rate (CAGR) calculator – but on a monthly period – with looking at the Compound Monthly Growth Rate (CMGR).
For example, starting the year at $100k ARR and ending at $1M ARR, you would enter those starting and ending values over 12 periods for a CMGR of 21%.
High-performing, early-stage startups grow at a rate of 3x year-over-year, requiring a CMGR of 10%. While in the seed stage or earlier, 5-7% growth on a weekly basis is a good target.
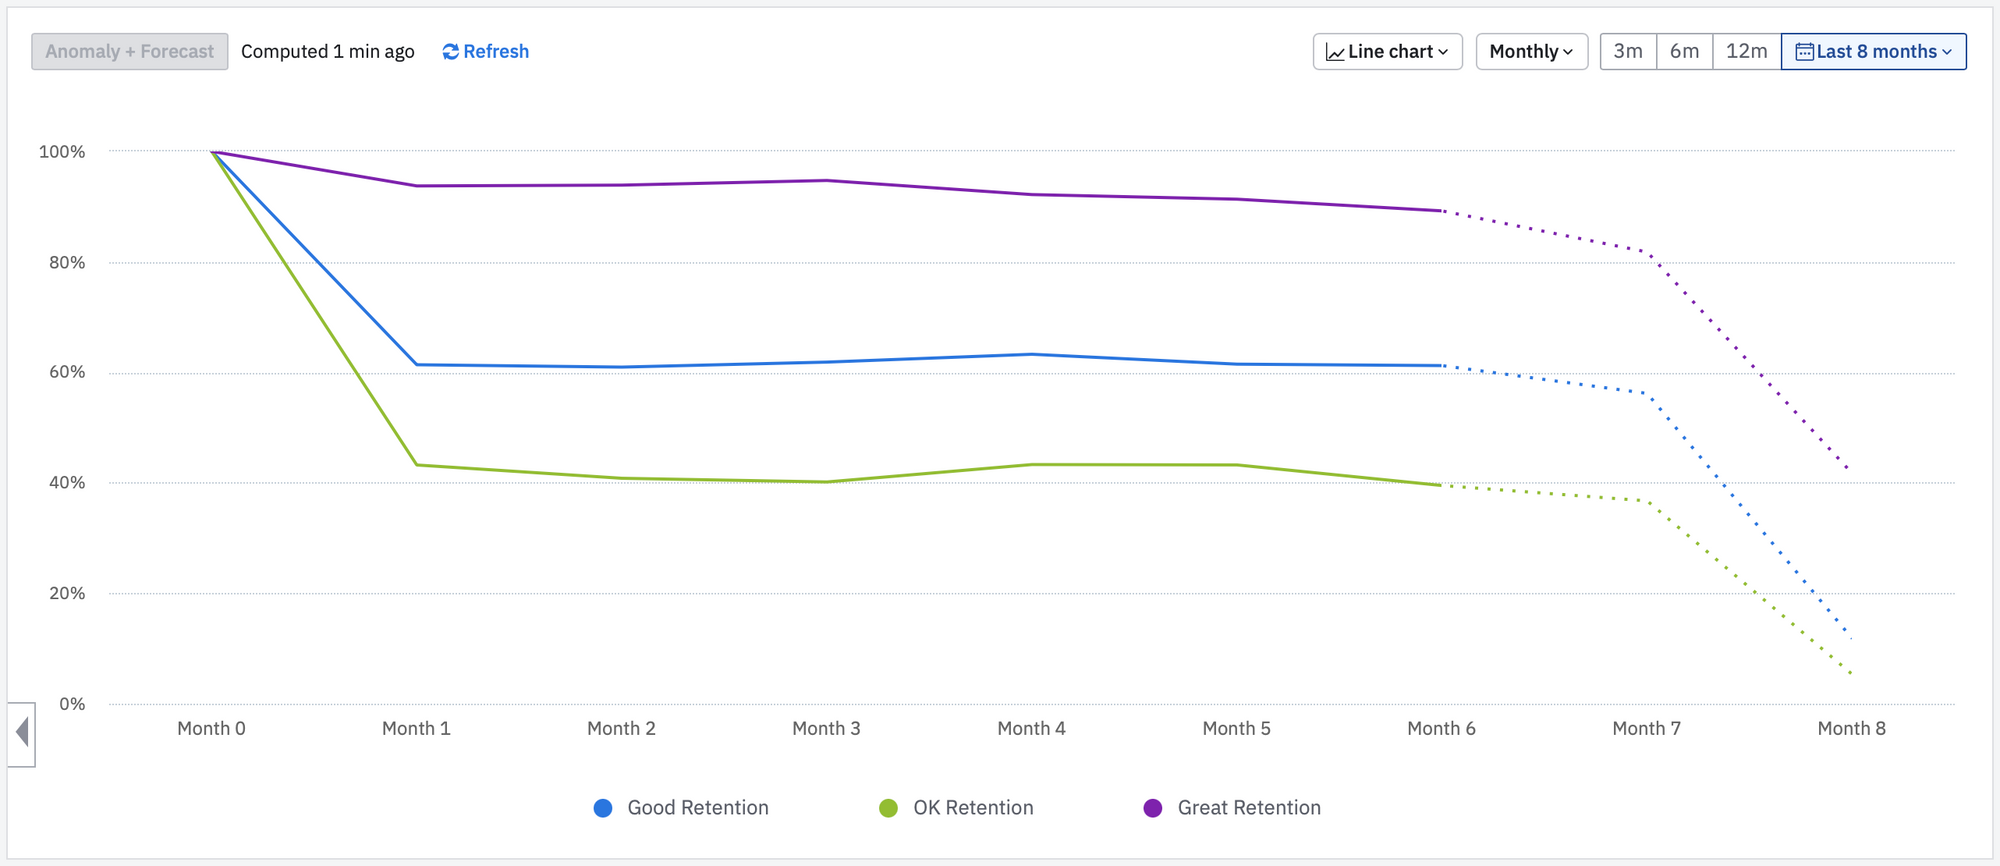
Measuring Retention
To measure retention, cohort analysis is used to track how many original customers remain over time. The percentage of retained customers is then analyzed for each cohort.
Dollar retention looks at how much revenue each cohort generates, while logo retention looks at the percentage of active customers.