Understanding the people using your product by synthesizing insights
How modern product teams understand the needs of people using their products, and diagnose problems with quantitative and qualitative insights

Transcript taken from a presentation at the 2026 PUSH Discovery Conference with the original slide deck available at the end
Steve Jobs is one of the greatest product people of all time, but not just for the reasons he's famous for, and especially not for the misnomer that he believed that you shouldn't talk to customers.
In the video below, Steve presents Next's progress and takes questions from MIT students in the early 90s. Watch as he talks about customers needs and the market.
This was the time between Apple, where he built Next, the foundation for today's macOS and iOS. And he constantly asks questions back to the audience.
Wherever he went, Steve triangulated the data presented to him in the office with real-world narratives that helped him sense check real customer needs and perspectives.
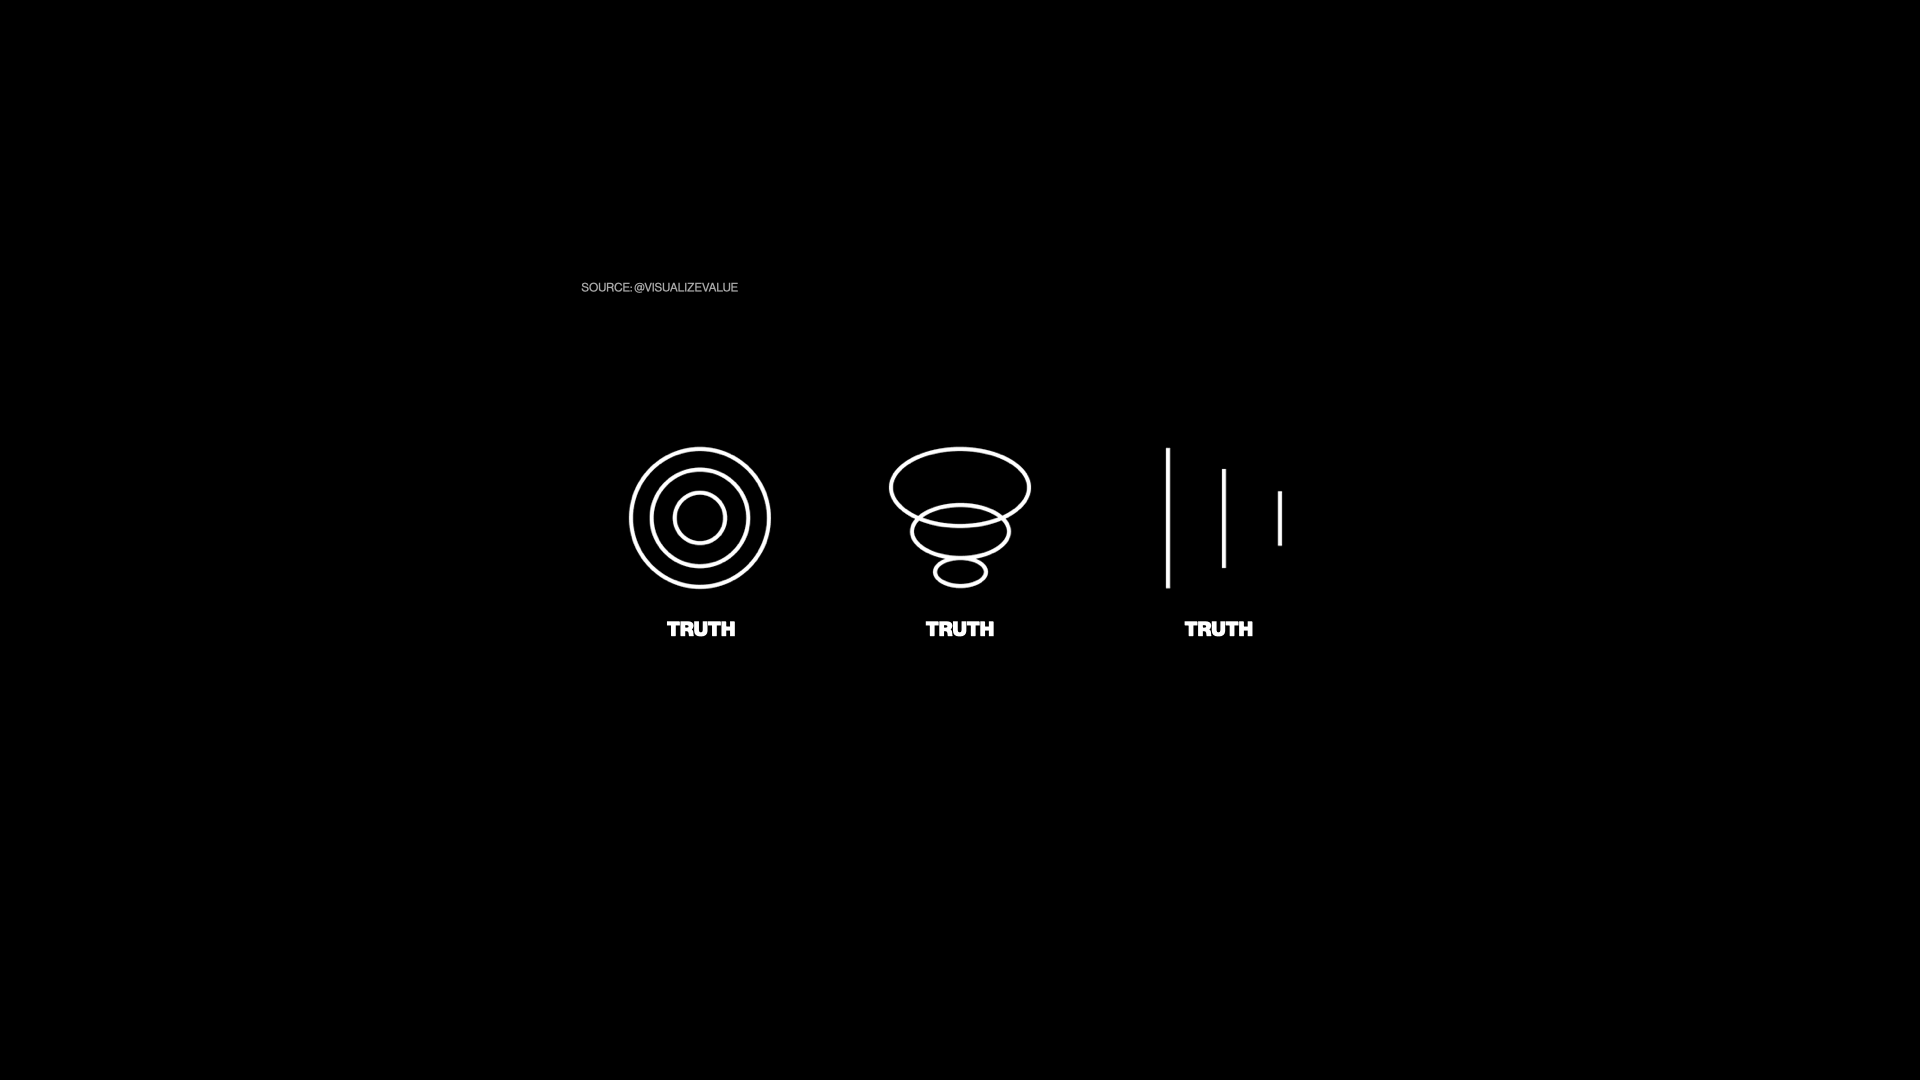
What is true?
Modern product teams have a wide array of customer insights at their disposal, and they are all different perspectives on reality.
I'm going to break down the types of customer insights, what those insights are telling us about our product and the people that use it, and finally, how to keep score with a simple acronym, DARE.
Delivery, and sometimes Discovery
If you are not familiar with Productboard, we help companies make products that matter to their customers by building a customer-centric product management platform.

And in looking at how our customers use Productboard, every company does delivery. Their days are likely numbered if they don't.
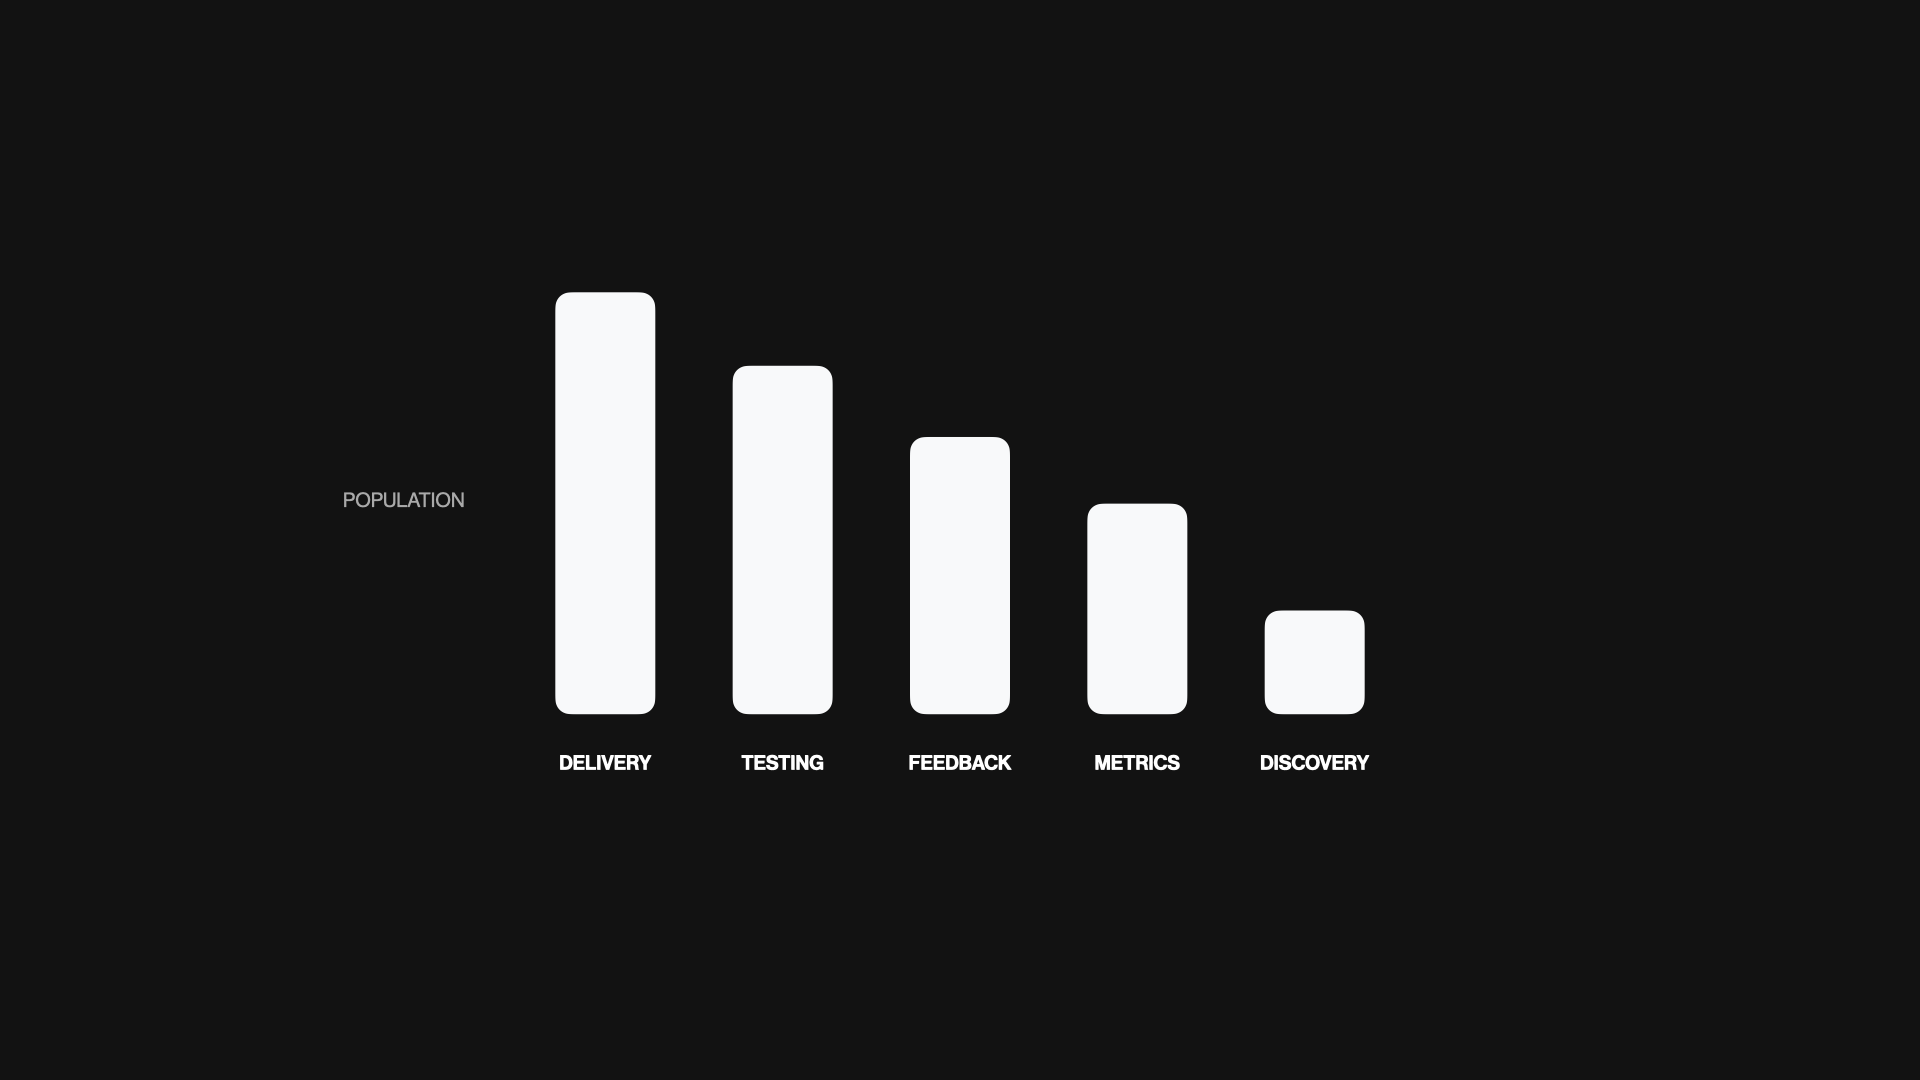
But the interesting thing about Discovery is that most companies struggle with this practice. If we break Discovery down into talking to customers, analyzing metrics, reviewing feedback, or testing prototypes, it's clear that not everyone starts with the customer or user.
In fact, when looking outside of Productboard's customer base and surveying the broad product management industry, the world looks more like this...
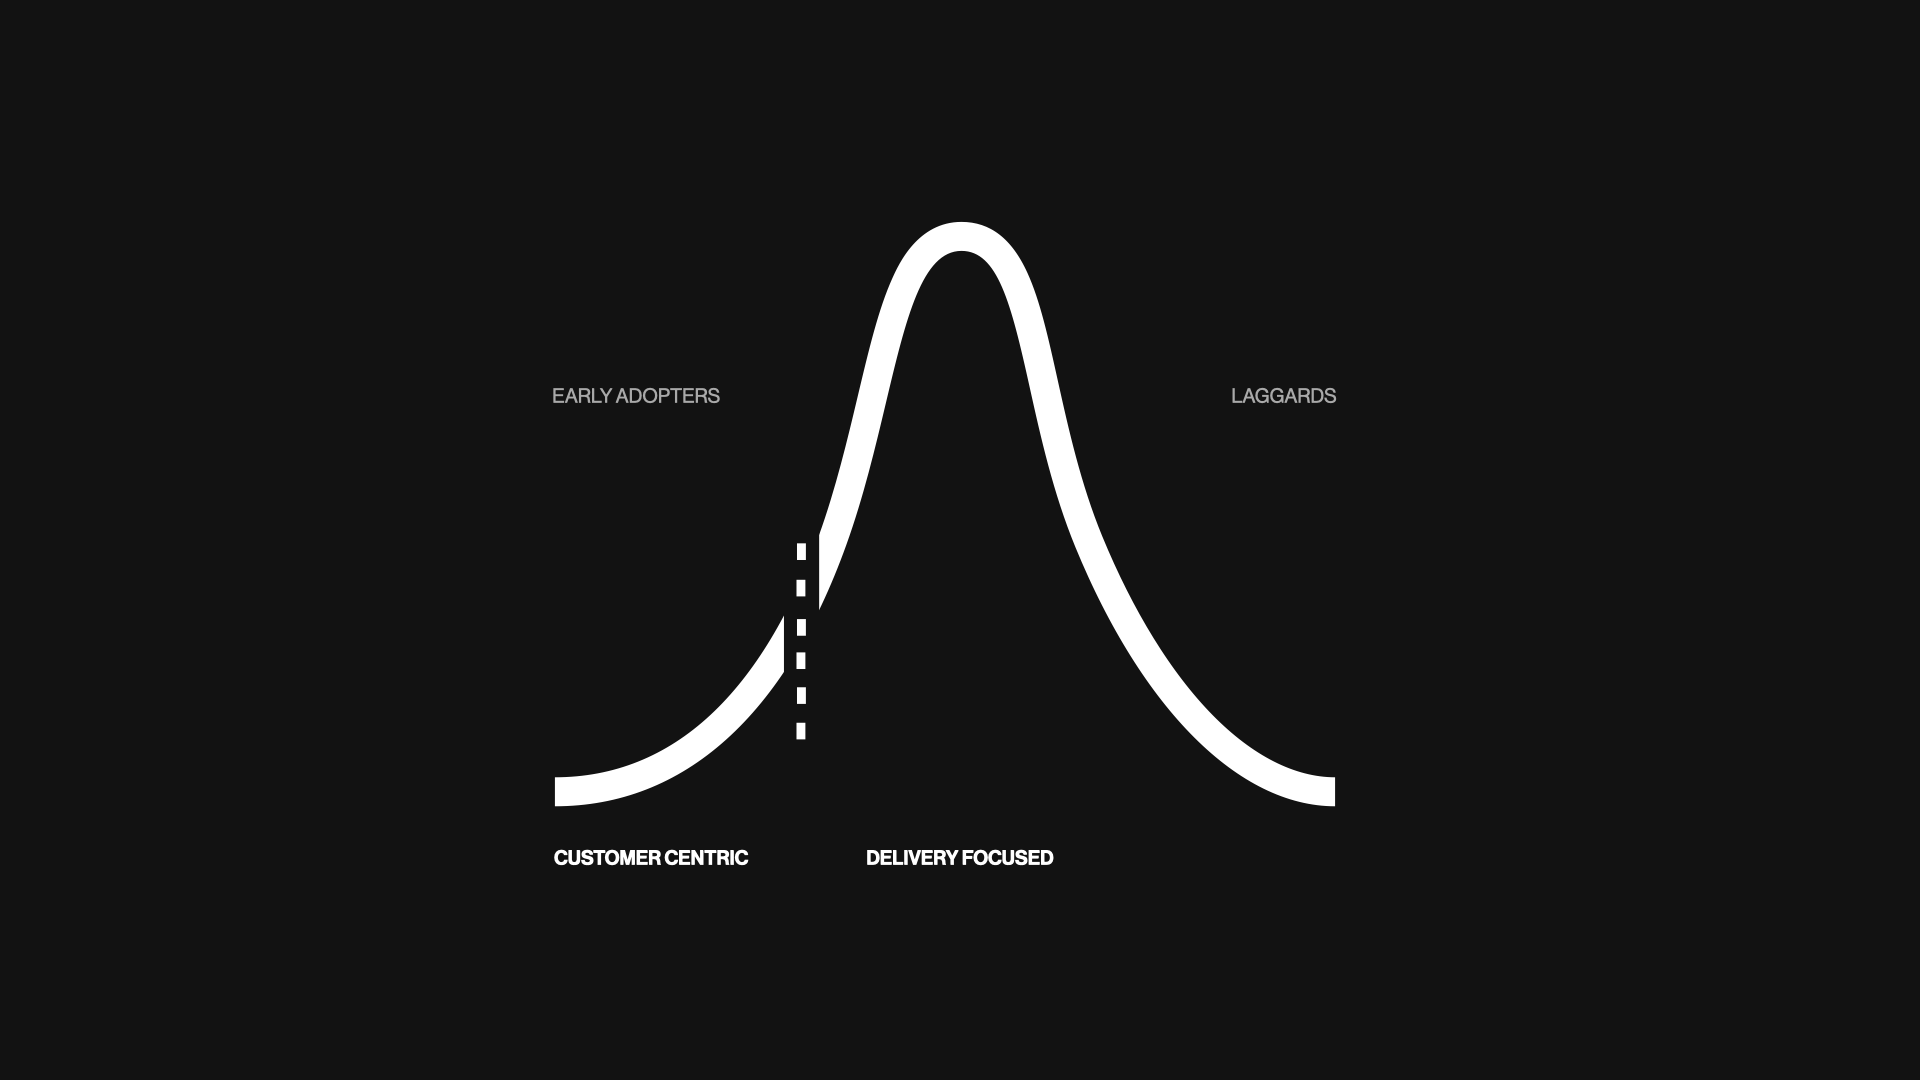
...where Product Discovery is the realm of early adopters, and most people rely on instinct or others at the company to have any meaningful interactions with the people that use the products they make. You can read more about the broader product management market at productexcellence.co.

What's interesting to me is this: if you work(ed) in design or at an agency, you are likely very familiar with the concept of discovery. It's a crucial first step to delivering the right solution.
But for some reason, it's still an emergent practice for product teams and product managers, despite being both the foundation for creating a new startup – and also one of the key ingredients to the massive success of consumer products from giants such as Apple or Meta.
Sources of Customer Insight
I believe this is the best time to build products. I still remember hooking up Urchin – the precursor to Google Analytics – to all of my projects back in the early 2000s. It was exciting to see real people using my work.
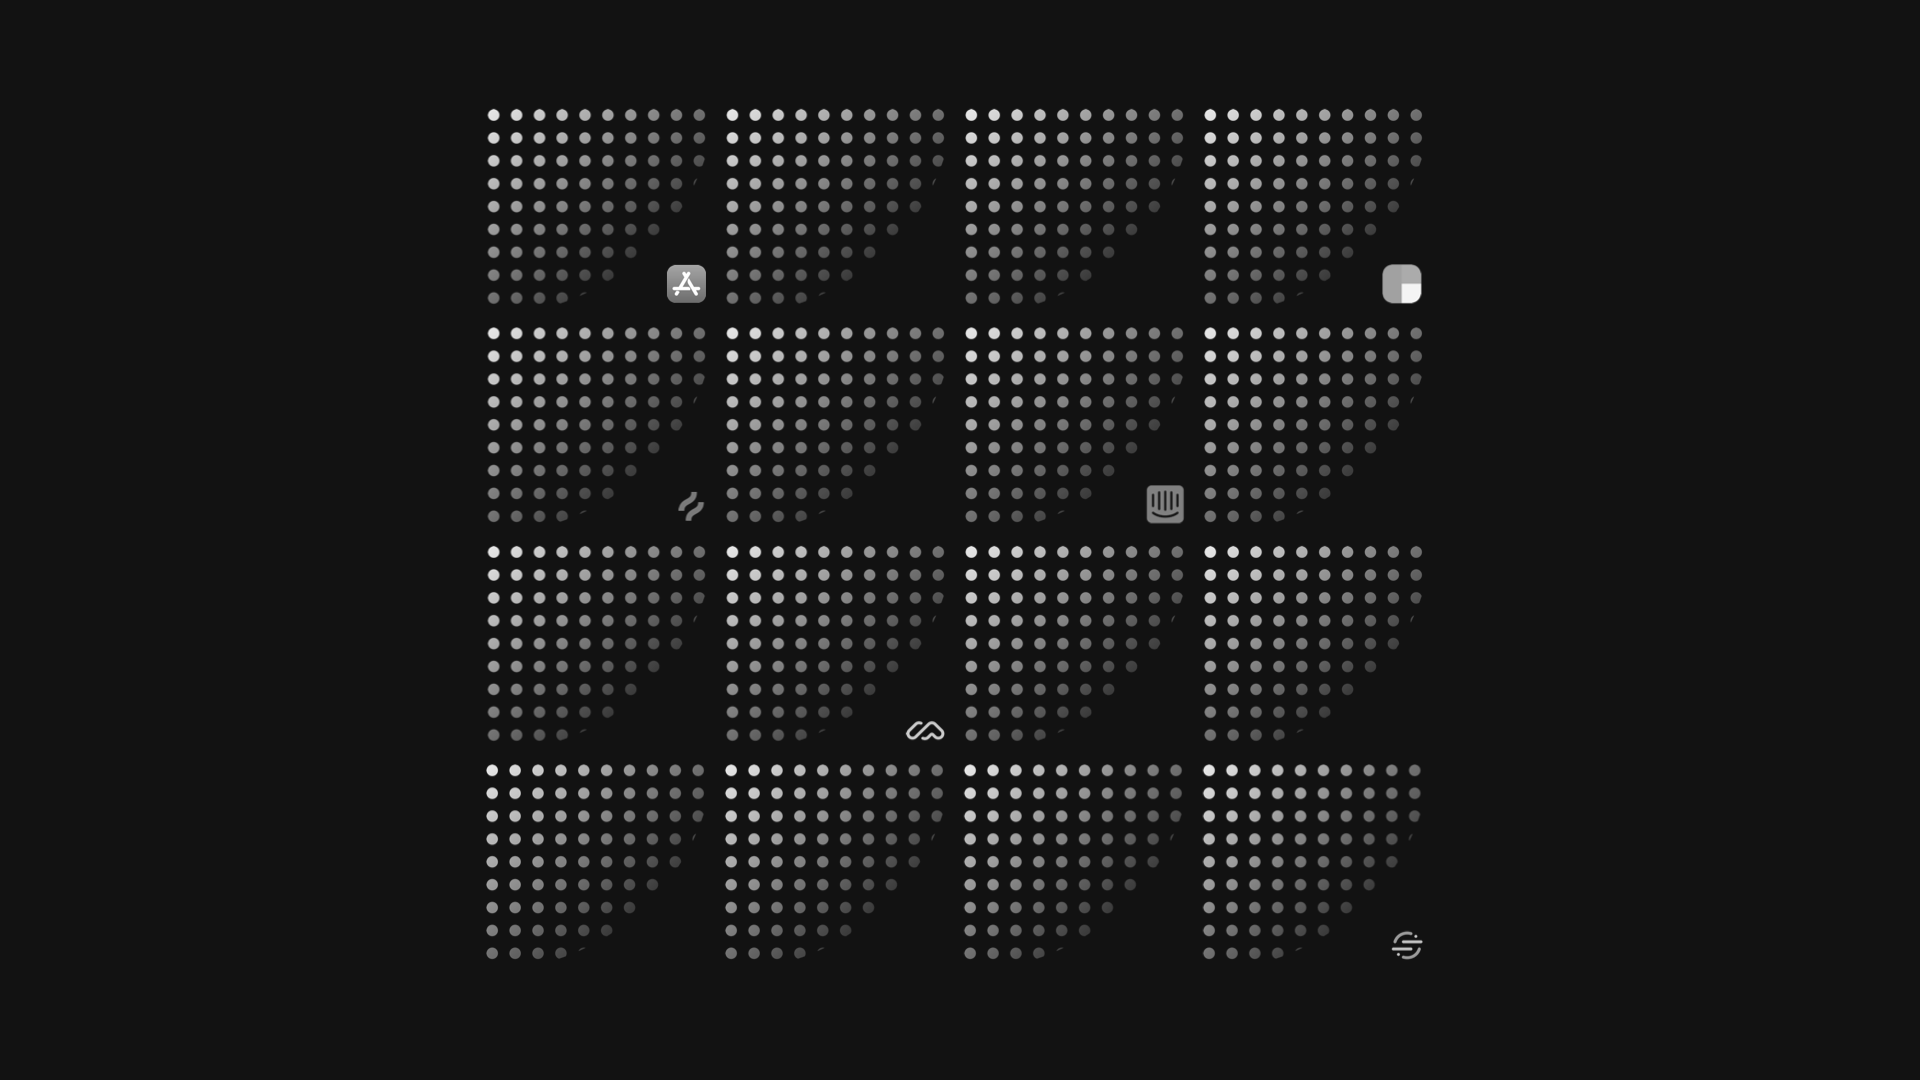
Today, startups and modern product teams have more sources of customer insight than ever before, with both B2B and B2C product teams having unique tooling.
B2B teams benefit from the firmographics enriched from Clearbit and stored in CRM platforms like Hubspot or Sales conversations recorded, transcribed, and analyzed in tools like Gong.
B2C teams benefit from aggregated, global reviews in the Apple and Google app stores, as well as the on-demand testing panels on platforms like UserTesting.com or Maze, where you can run user testing in hours instead of days or weeks.
And no matter the type of product, everyone benefits from great survey tools like Typeform and Sprig, session analytics in tools like Hotjar or Fullstory, or product usage data in platforms like Amplitude or Pendo.

I'll leave it to others to judge whether now we have too much data. But in either case, modern product teams have a broad mix of quantitative and qualitative data at their disposal to understand the performance of their products and the people using them.
Making Sense of Insight
At Productboard, we aim to centralize all available customer feedback into one repository. This has a time-saving compounding effect across product organizations as teams don't have to go far to find insight. We have teams of people whose day-to-day job is thinking about how best to do this. Here is how we make sense of the different sources of Customer Insight as we build Productboard.
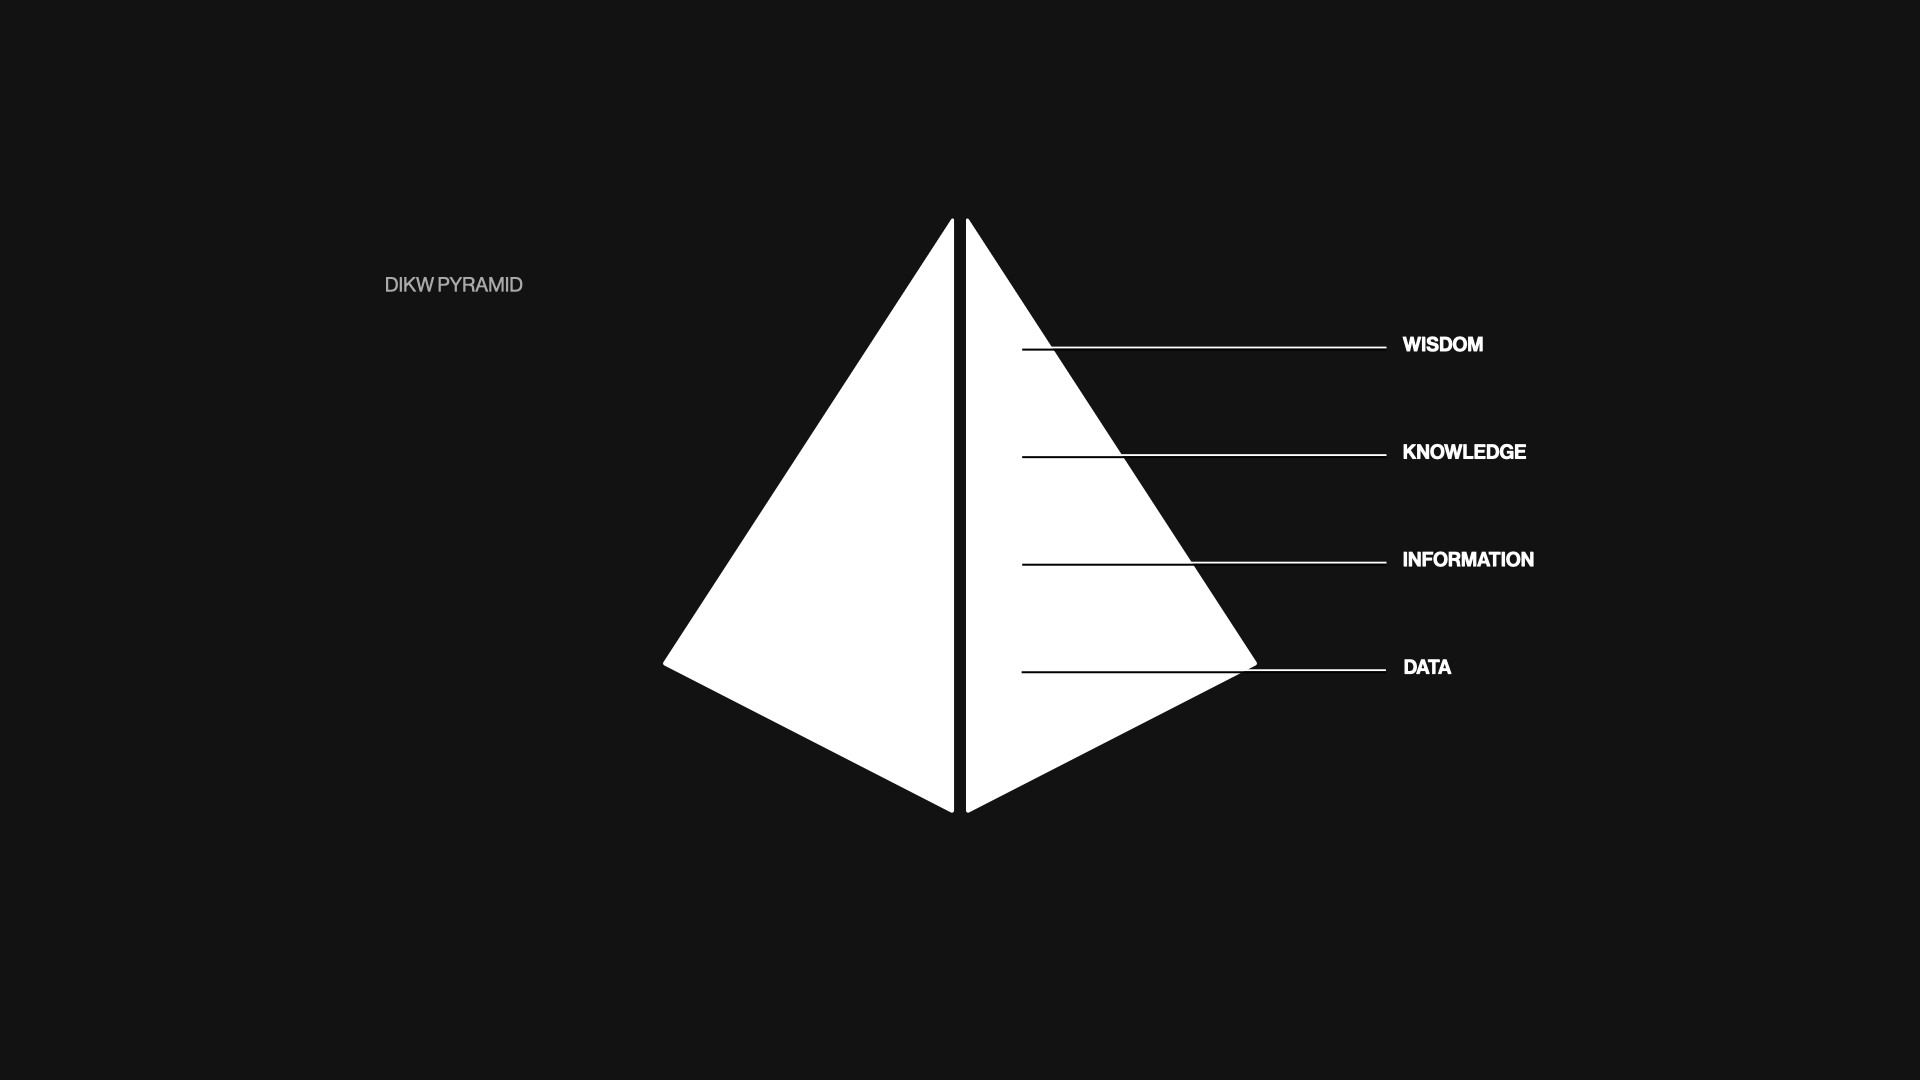
Inspired by the DIKW – Data, Insight, Knowledge, and Wisdom – pyramid, we think of the collection of all customer insight flowing through a three-step system...
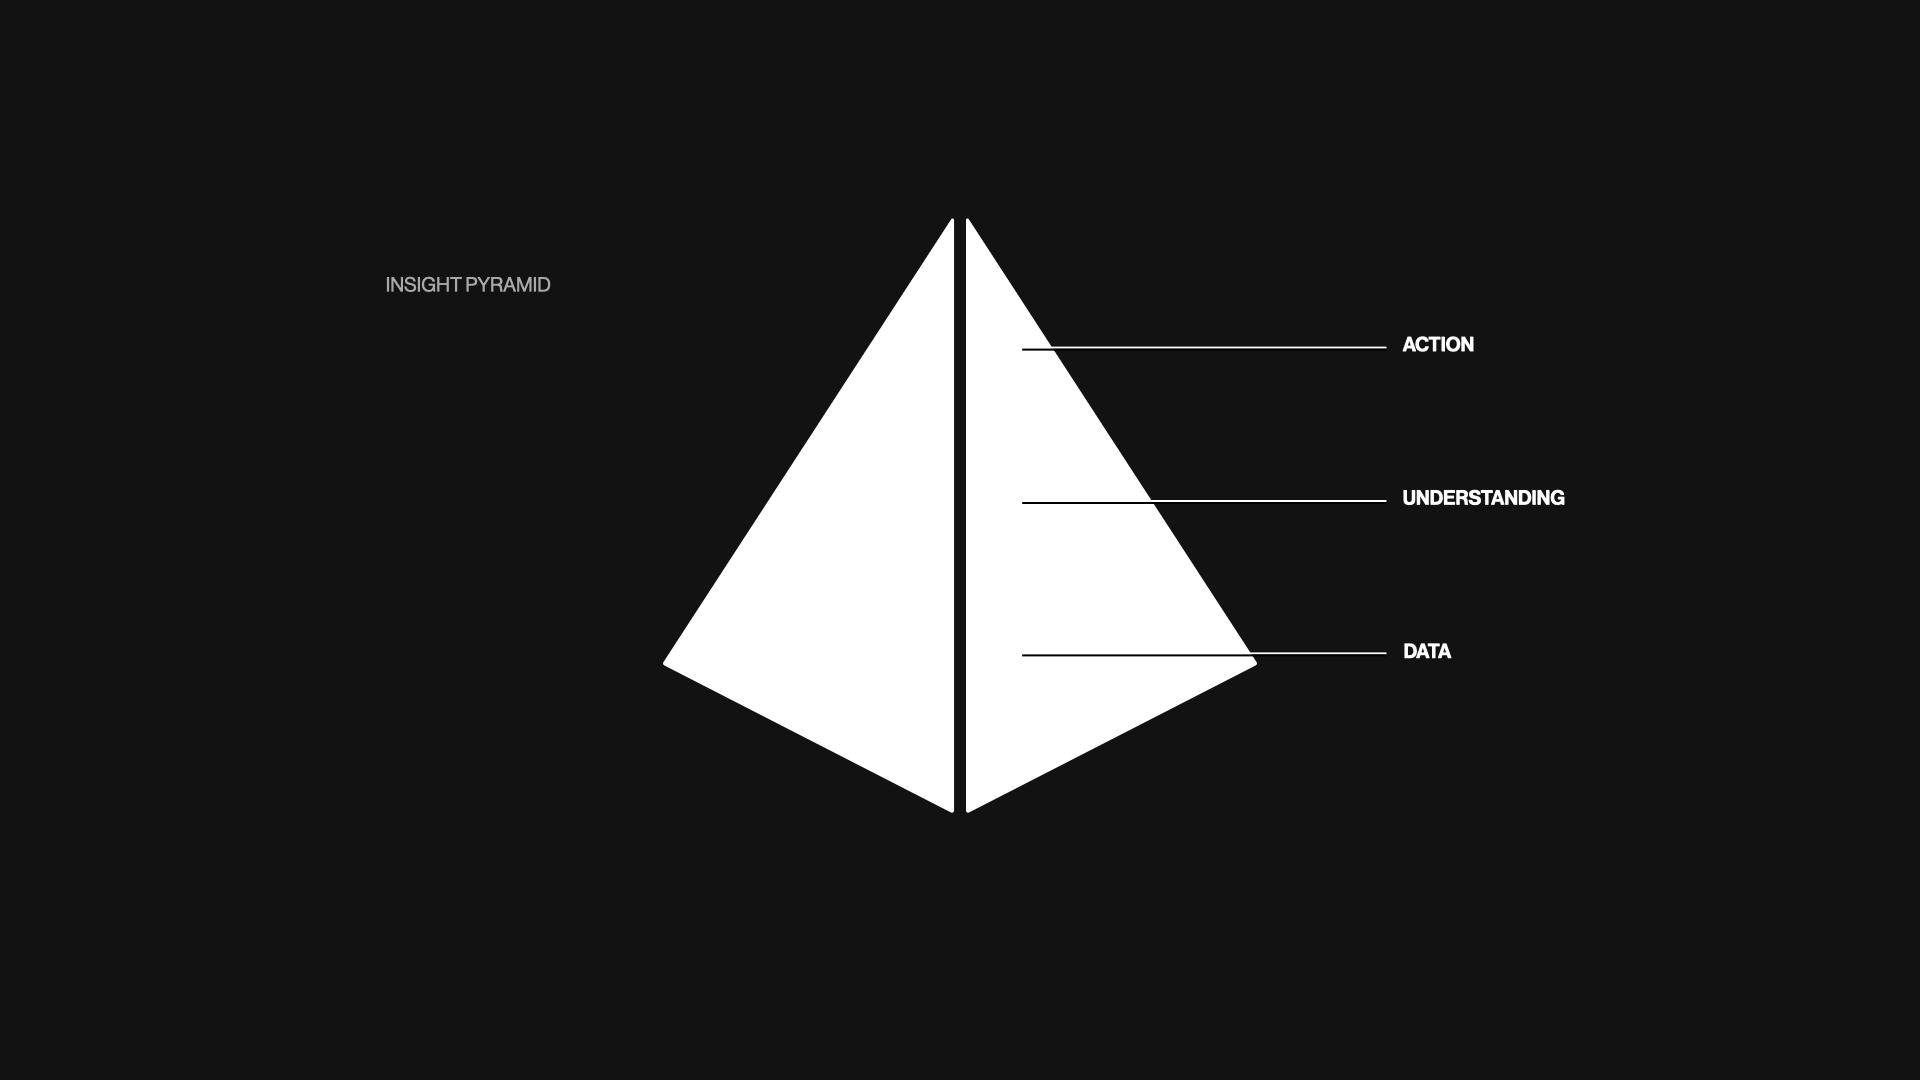
... from data – such as feedback or metrics – to understanding – which happens once that data is synthesized or clustered based on patterns or outliers – and finally into action – where teams then make decisions and ultimately changes to the product, or introduce new products altogether.
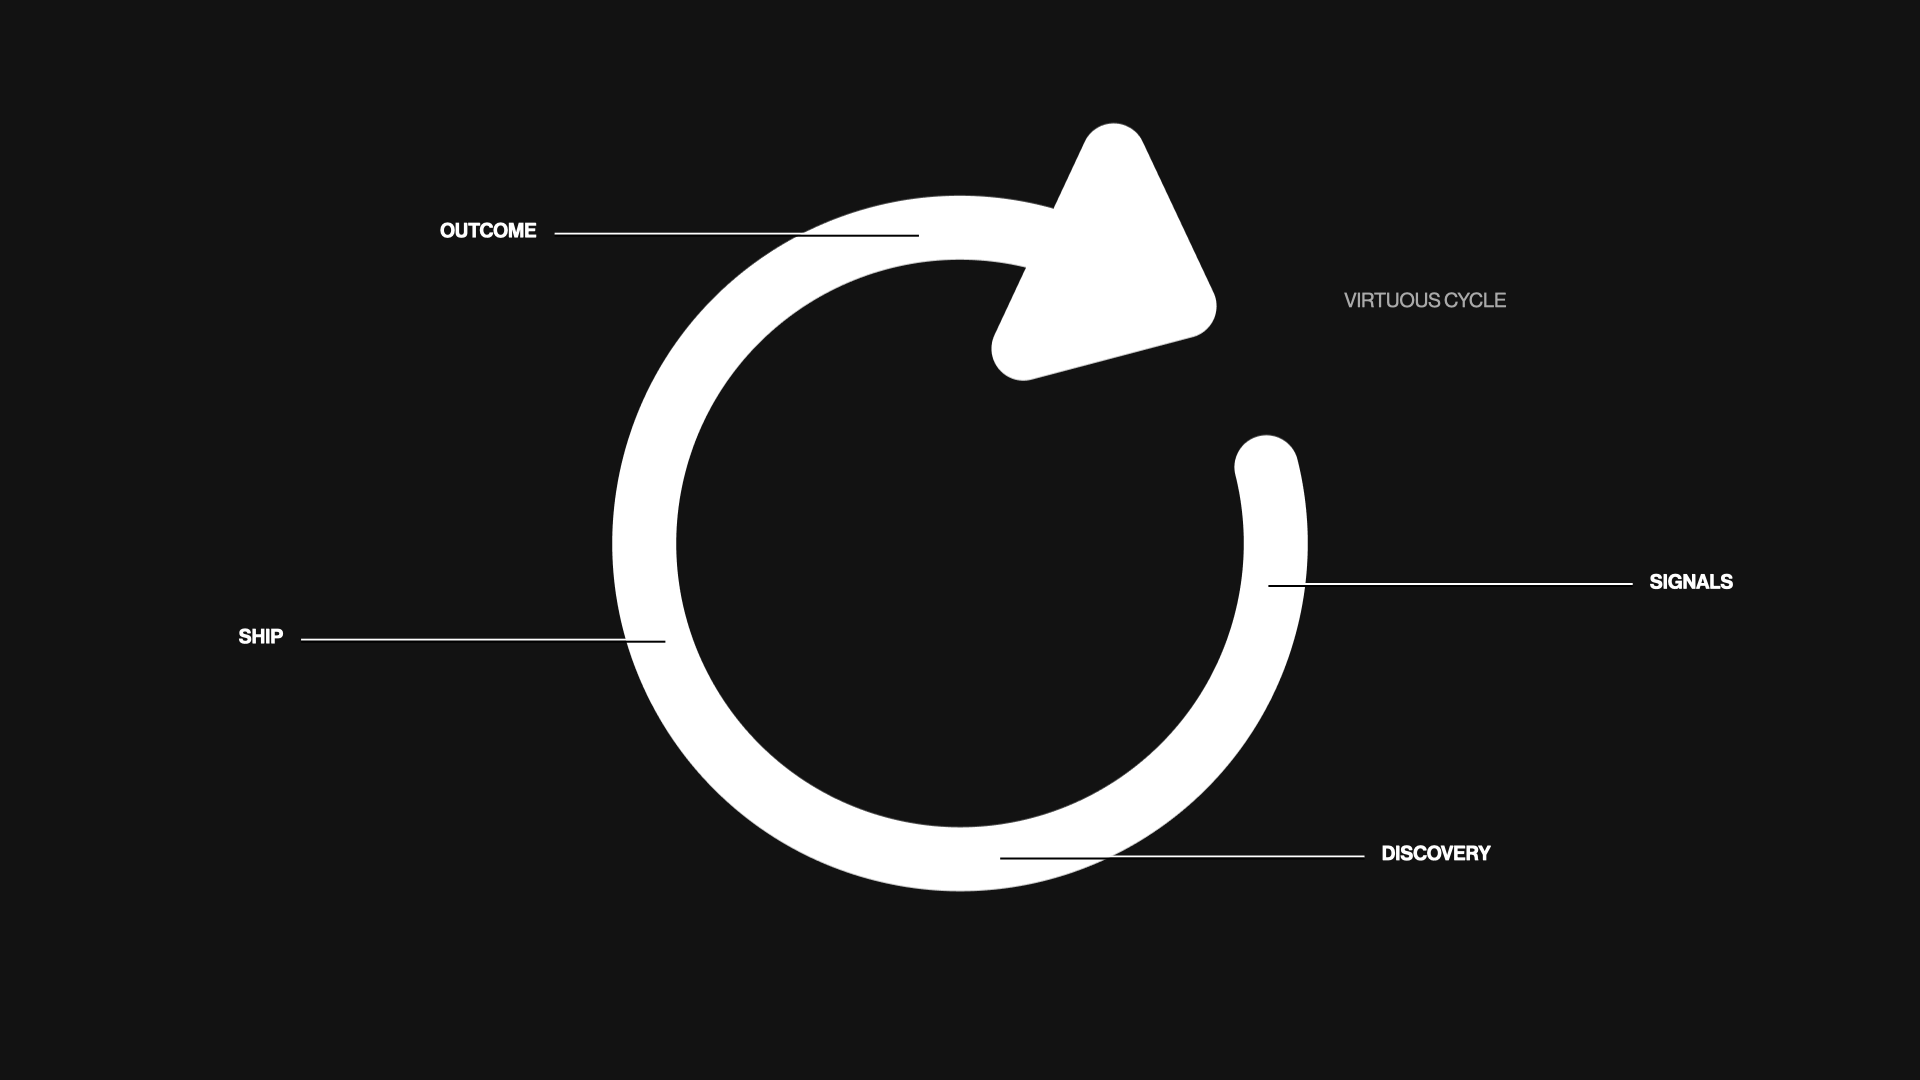
In a perfect world, you get a virtuous cycle that starts with some sort of signal from your customers and users and ends with the desired outcome for them – before compounding into a new loop with new signals, both quantitative and qualitative.
But, I think the downside to labeling everything as signal or data misses the nuance of what those signals can tell us and how we can use them to make better decisions.
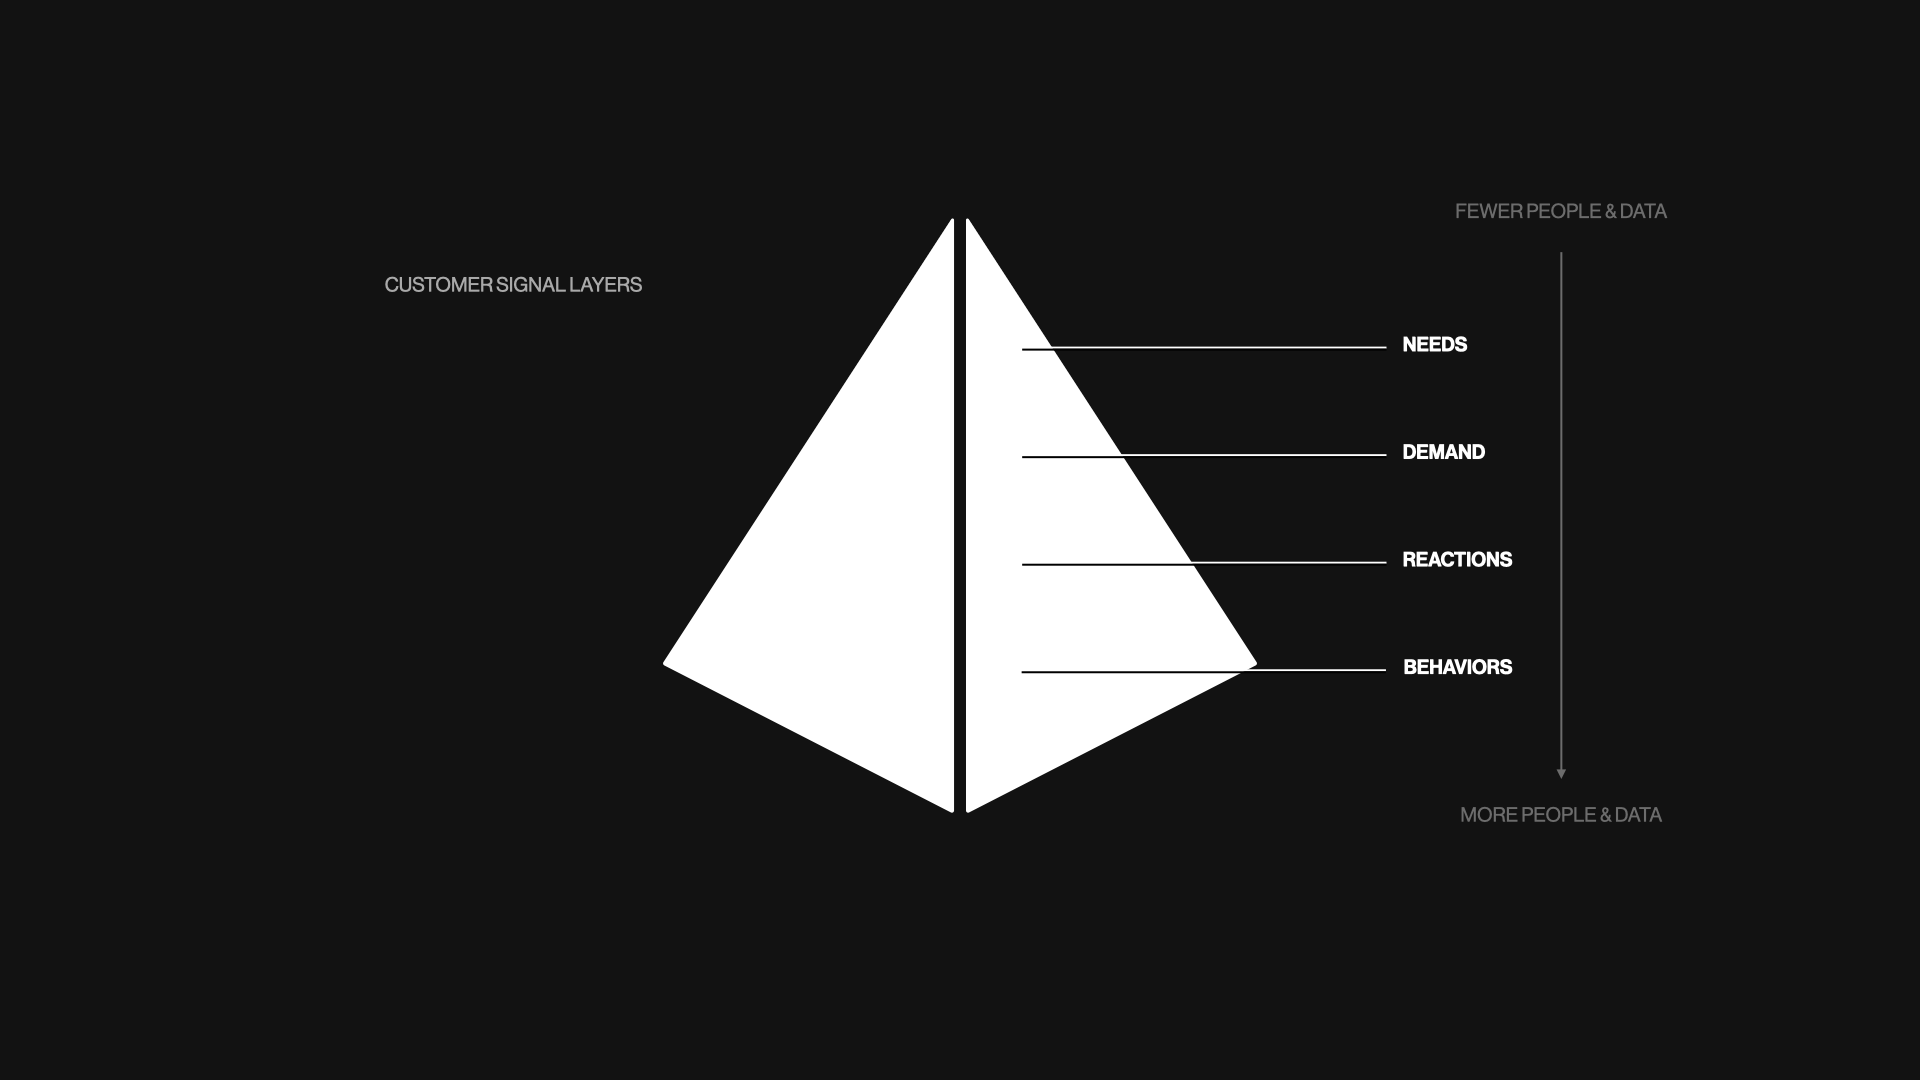
A Consumer Signal Stack
Let's restack those signals and data that modern product teams have at their disposal. They tell us the behaviors of our users, the reactions they have to our products, the demand from the market, and the needs of our target customers.

Starting from the bottom of the stack...
Web & Product Metrics
Behavior comes from our web or product metrics. This is what our users are actually doing in the products we build. We not only can see what they use but also the organic frequency of a need that brings them to use the product – also known as their habits.
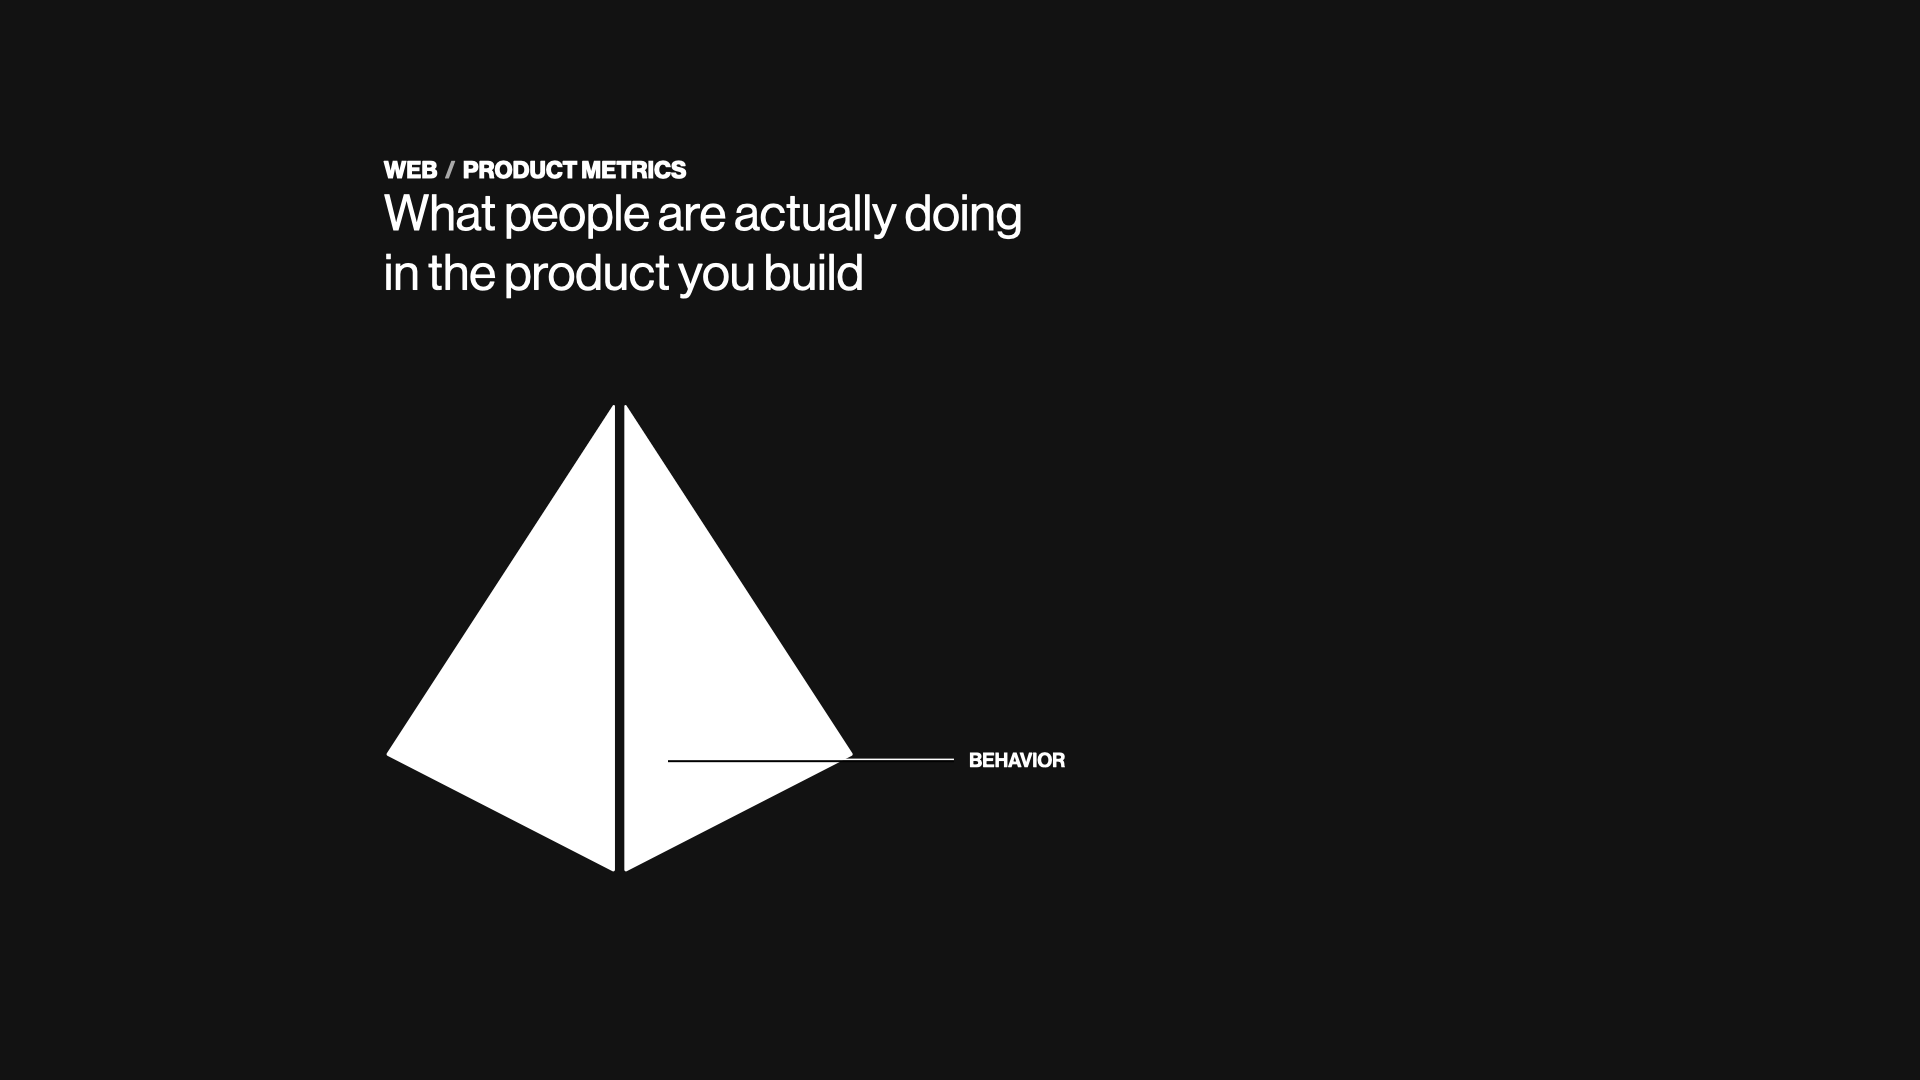
For B2C products, daily usage tends to be the holy grail of outcomes because it optimizes for attention and brand loyalty, while for B2B products, the threshold to cross is that people use the product twice per week, each week of the month.
 Stephen M. Walker II
Reviews, Customer Support, Feedback, and Surveys
Moving into reactions, I like to think of this as what you could have done better if you had a time machine and could do the work all over again. When launching a new product, this feedback helps you get to Product/Market Fit (PMF).
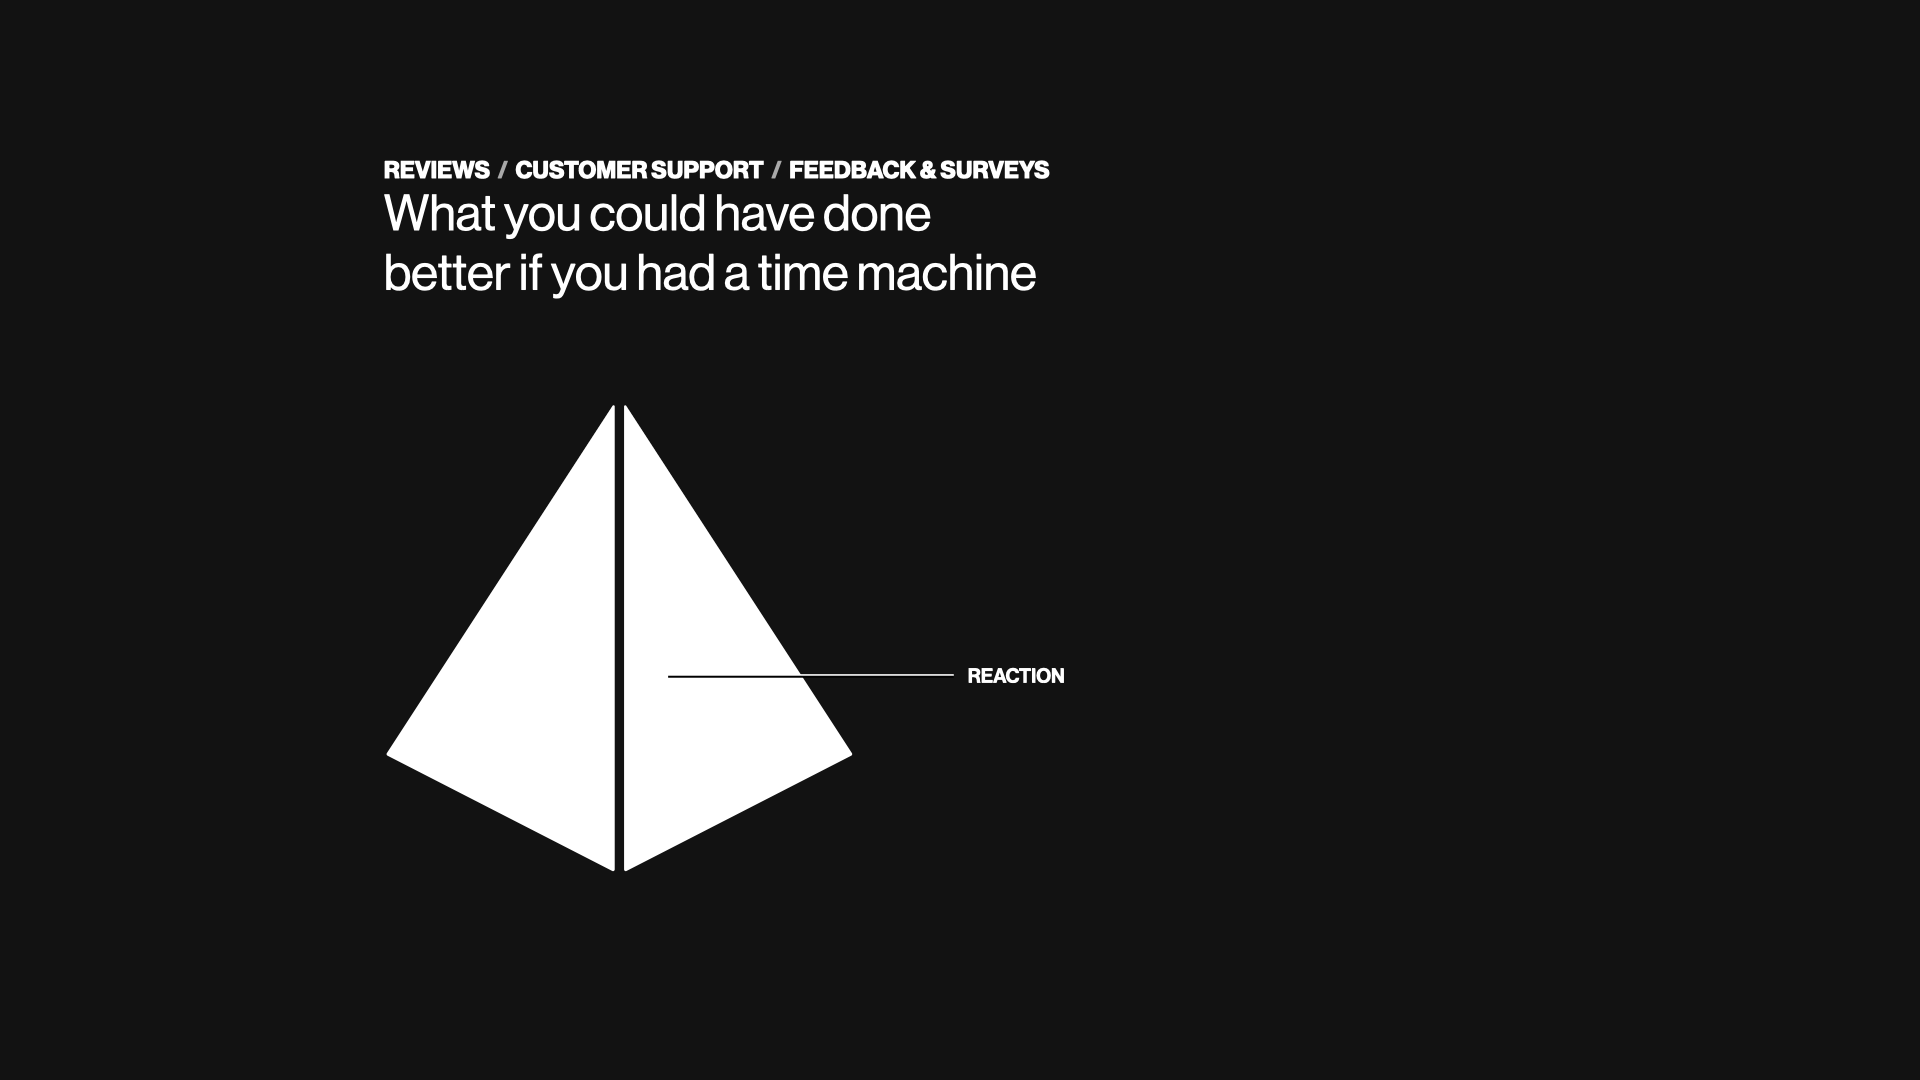
Once you have strong PMF fit, one thing you will notice is that your users may rate you high on a numerical scale but still provide feedback on new activities or use cases they wish your product supported.
As you acquire or drift into new segments and lose PMF, you tend to see the presence of low ratings accumulate.
And at scale – regardless of fit – this feedback generally represents a very vocal minority of your customer base – between 1-10% of the actual people using your products.
Market Research and Expansion & Sales Gaps
Demand is an interesting category. For many product teams, this one is the most divisive and frustrating because it represents the needs of people that are not yet actual users or customers, requesting new functionality that may not be part of the current product strategy.
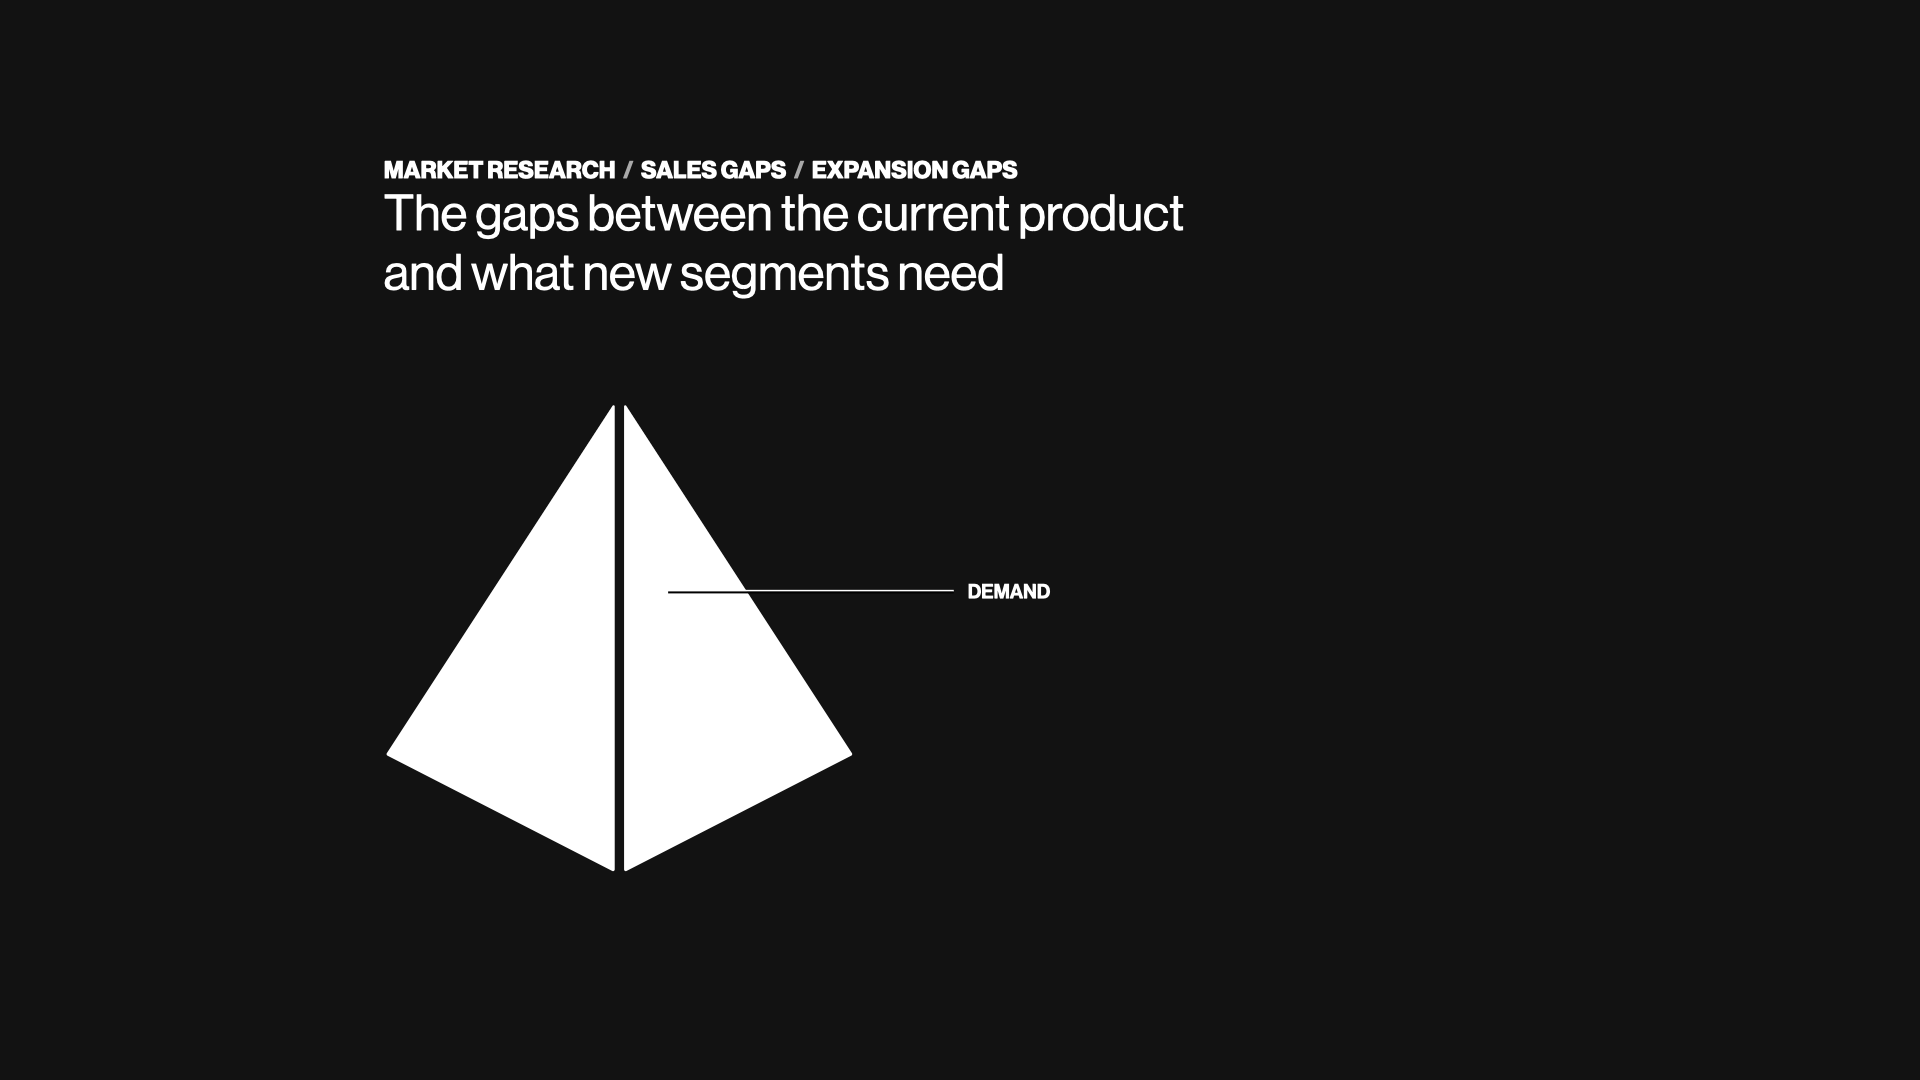
But it's one of the most important signals teams should leverage to develop their long-term product thinking. It highlights the gaps in the current product offering and the needs of new customers in new segments. These people are potentially the future growth of your business and product.
B2C companies typically do market research surveys (as do B2B), while B2B is continually gathering similar data points via Sales & Marketing teams trying to push into new segments or Customer Success trying to expand adoption of a product at a current customer company into new teams or business unit.
Customer Discovery and Prototype & Usability Testing
Lastly, Needs encompasses learnings from product discovery, prototype testing, and usability testing. These learnings come from hands-on, intentional product teamwork to better understand a need or solution.

Where all of the other customer insights flow to the product team passively, this represents the proactive work the team prioritizes and does with their own hands. And because of this, whenever other data disagrees, the bias tends to be toward the learnings from this category.
Pace and Volume
Each of these moves at a different pace, with a different volume of people and data points. It's easy to get lost in the noise, so we often use proxies like personas, research briefs, or satisfaction scores to quickly sample and summarize the patterns within the data.
So how do we map the data to our product problems?
Framing Needs with Jobs to be Done (JTBD)
I use Jobs to be Done (JTBD) when talking about needs or use cases. If you don't use or like JTBD, you can simply substitute your favorite label to define product or feature capabilities.
New products succeed not because of the features and functionality they offer but because of the experiences they enable. – Clayton Christensen
If you aren't familiar with JTBD, it's simply a framework for defining the market segmentation through user behavior that is agnostic of the product or demographic.

It was proposed in the early 2000s by Harvard Business School professor Clayton Christensen who is also famous for coining the term "disruptive innovation," something most of us in tech has either said ourselves or were asked to figure out. Check out the book Competing Against Luck, where he originally published the idea of JTBD.
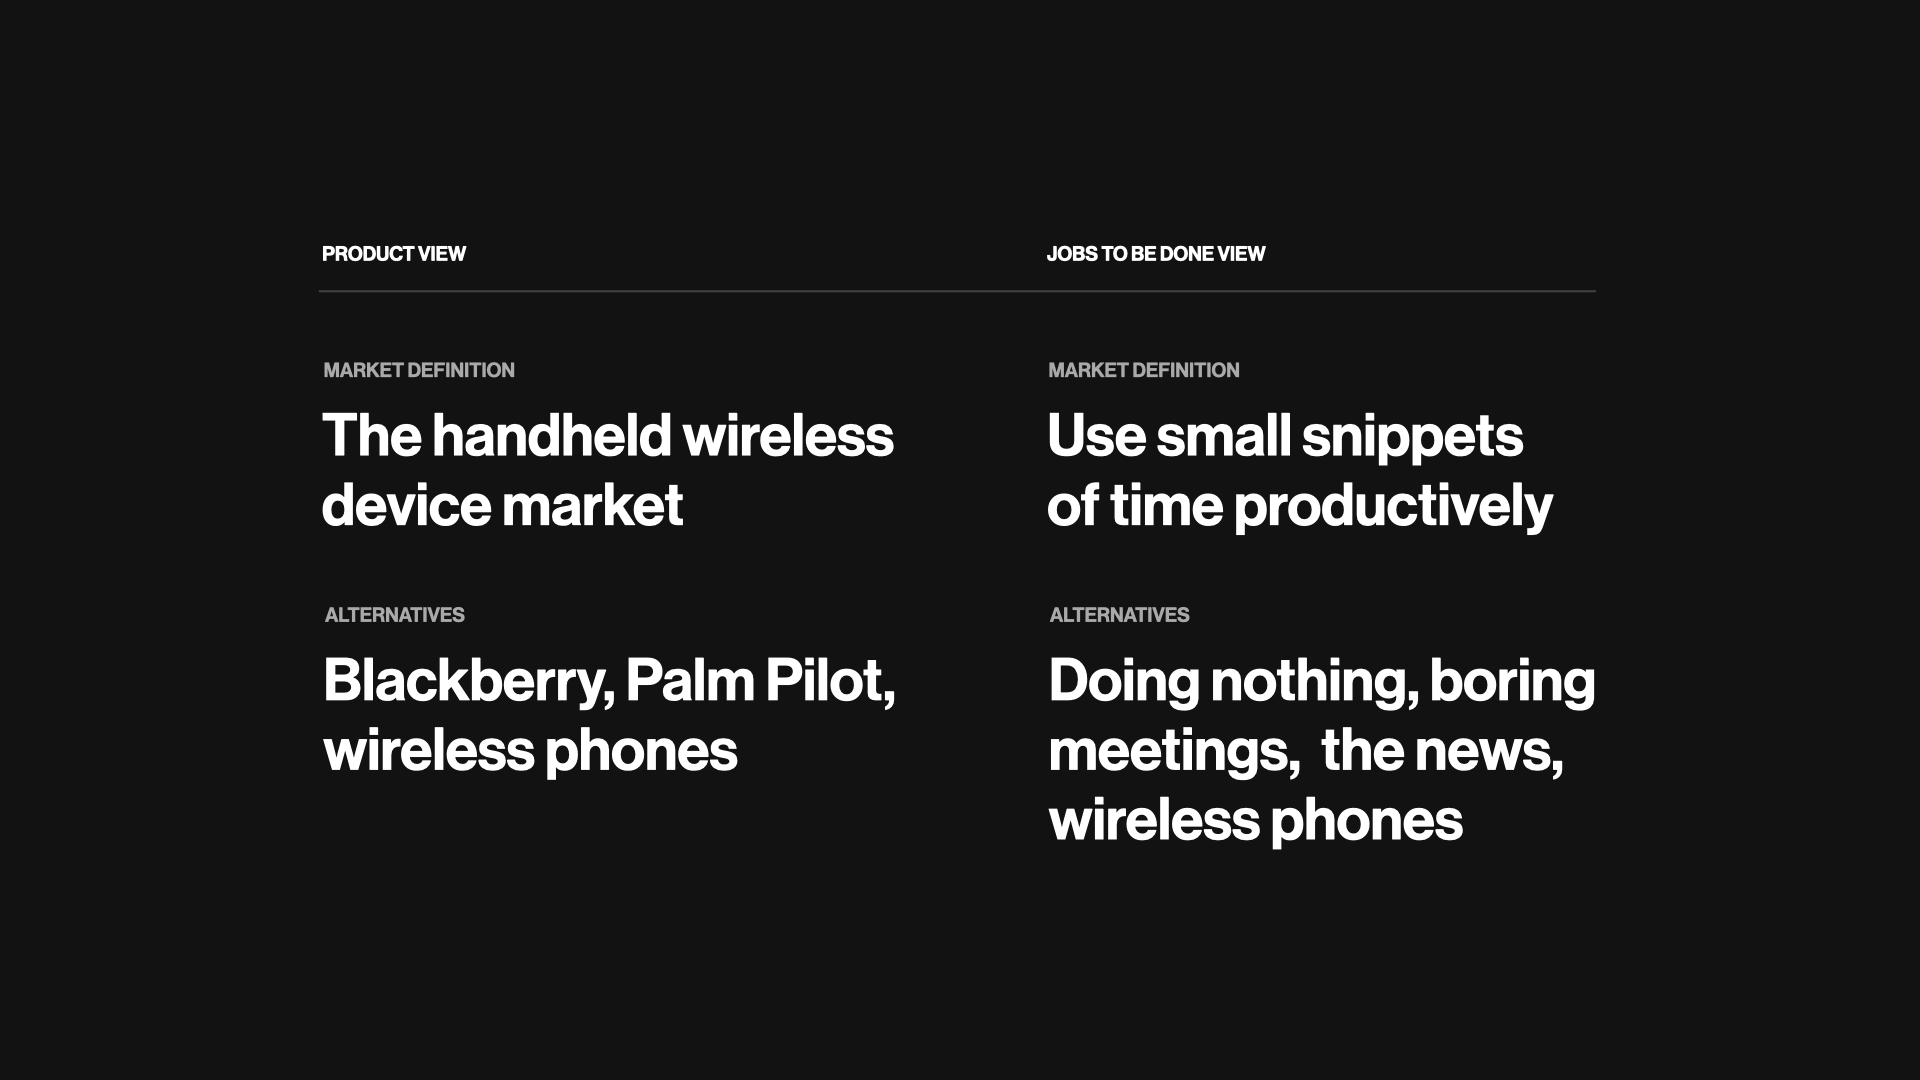
A quick comparison between a product view of the world and a jobs to be done view of the world – if you were to invent a smartphone for the first time today, this is how you might compare a product view of the market to a jobs to be done view of the market. Where one is focused on the existing solution – and – the other looks at the opportunity to innovate to solve the need.
The great thing about JTBD is that it packages up most of everything a product team needs to build and measure product success. It clearly defines the problem, the situational context of the target user or persona, the frequency in which they experience this problem, which in turn sets the expected feature usage frequency, and lastly, the desired outcome from solving the problem – both functionally and emotionally.
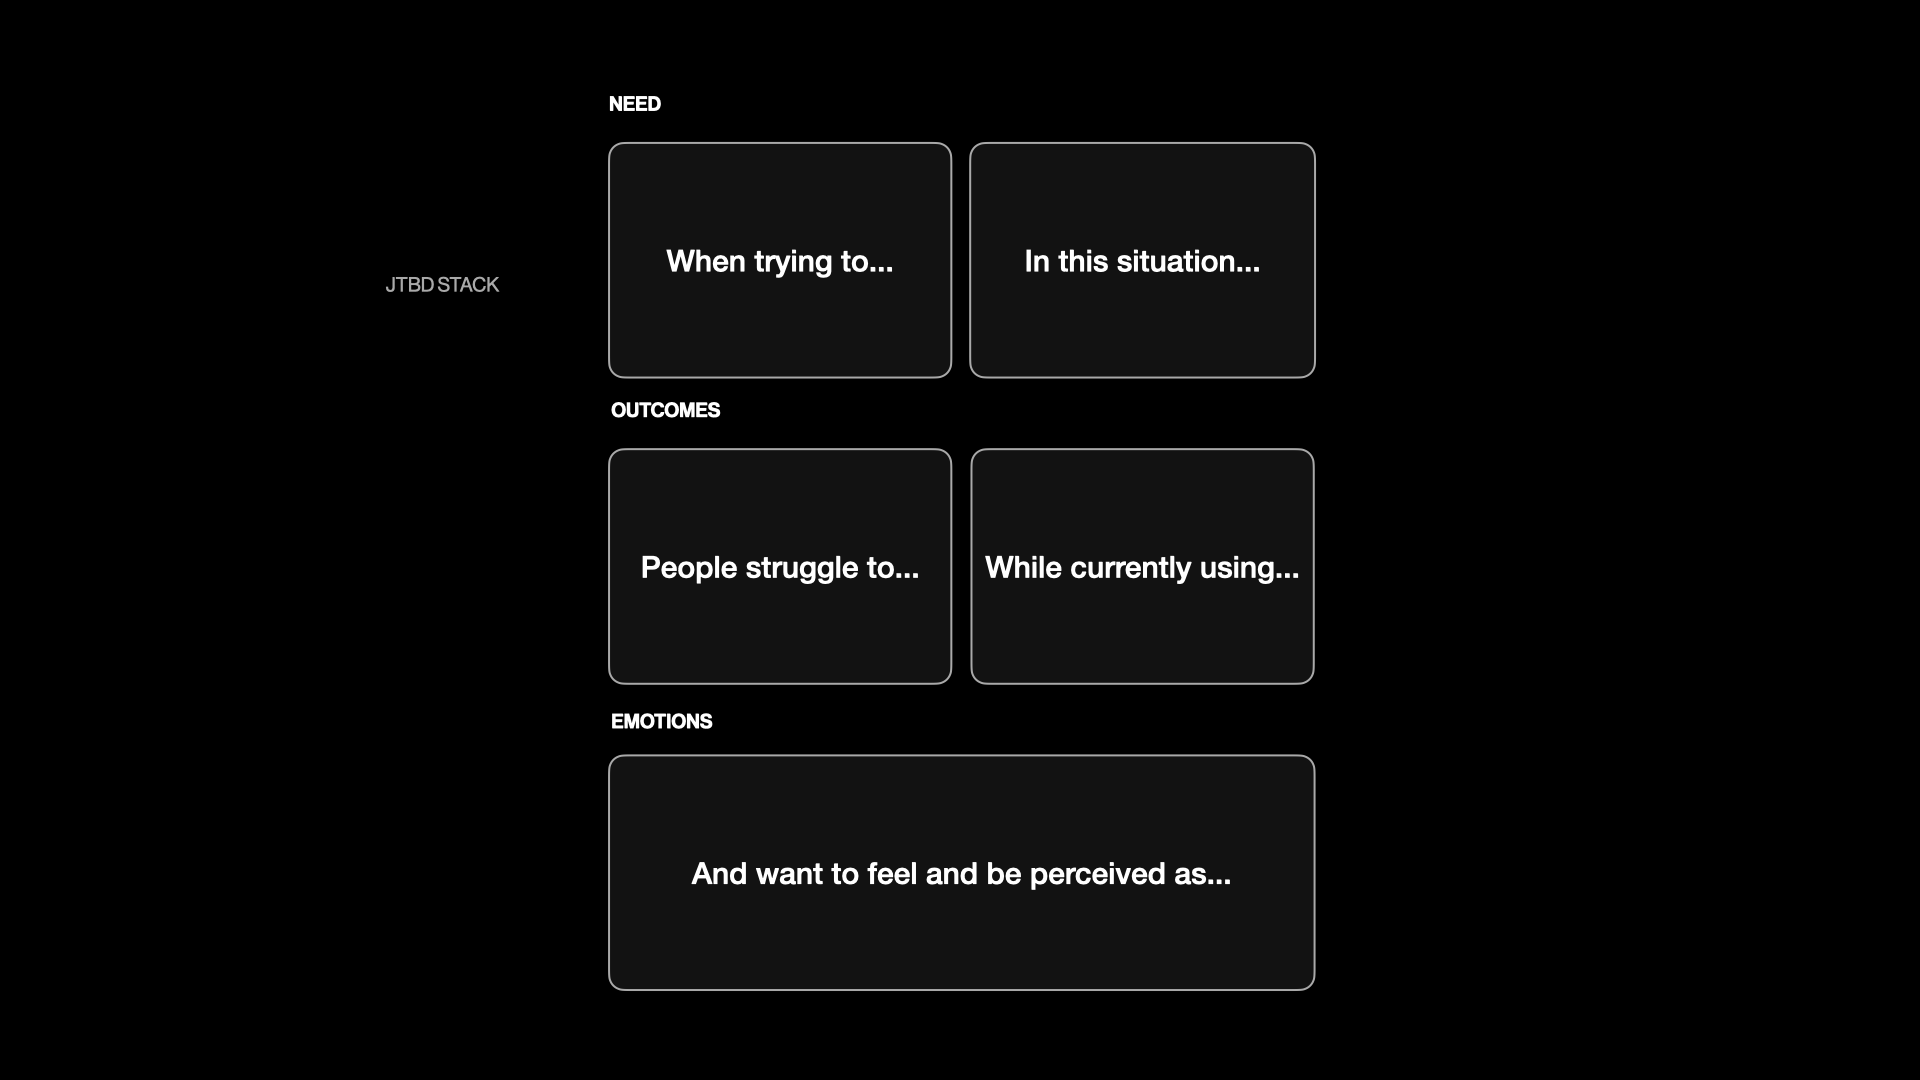
If you use the example from the smartphone world earlier, "use small snippets of time productively," all you have to do is ask people what a great outcome of using that time looks like for them. Do they complete their work faster and have more time for their family? Do they do twice as much work in half the time? Understanding this helps a product team triangulate real outcomes once the feature ships, and it also helps product marketing position the product toward the goals of the people using the product.
Let's take a look at how to keep score once you shipped something.
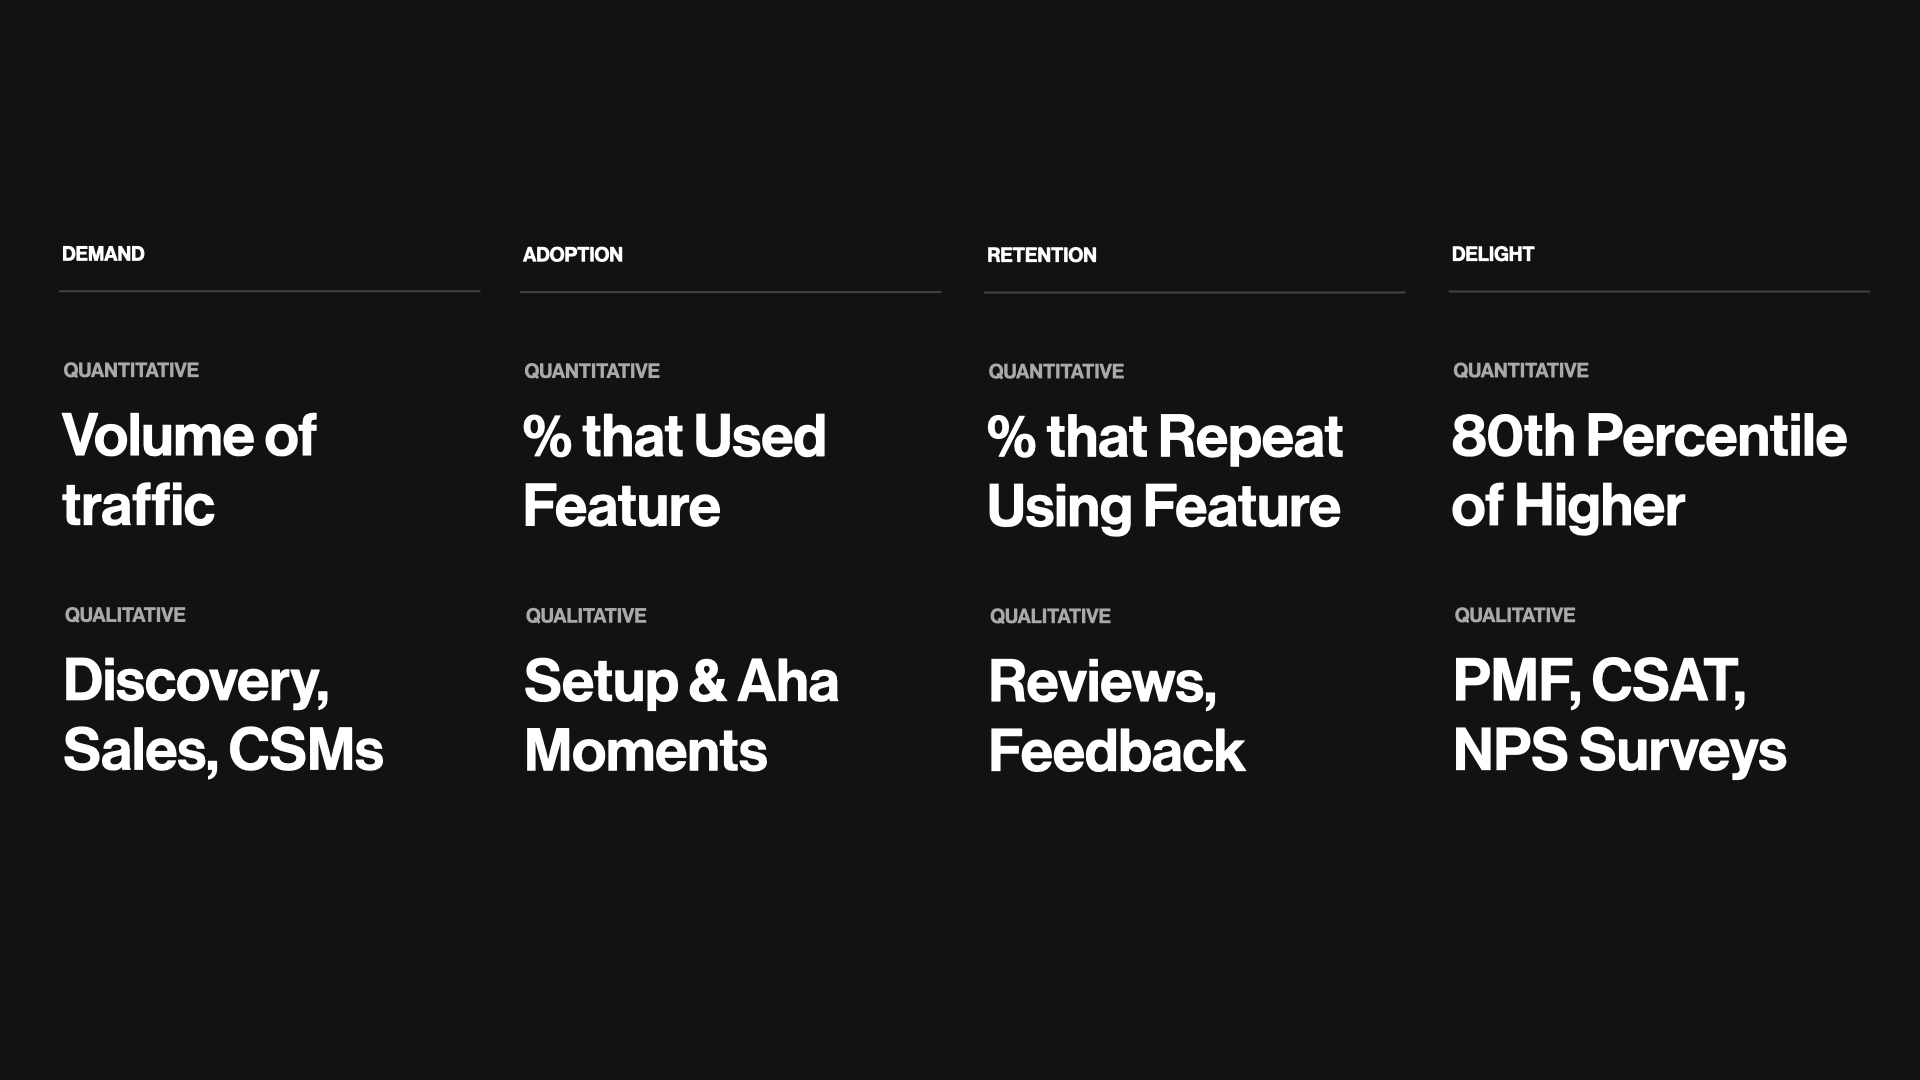
DARE – Demand, Adopter, Retention, Delight
Most product teams believe they don't have to worry about demand, that typically this is something that the growth or marketing org takes care of for them. Demand, or traffic, is a real problem for most features and products, especially when launching something new or expanding into new segments.
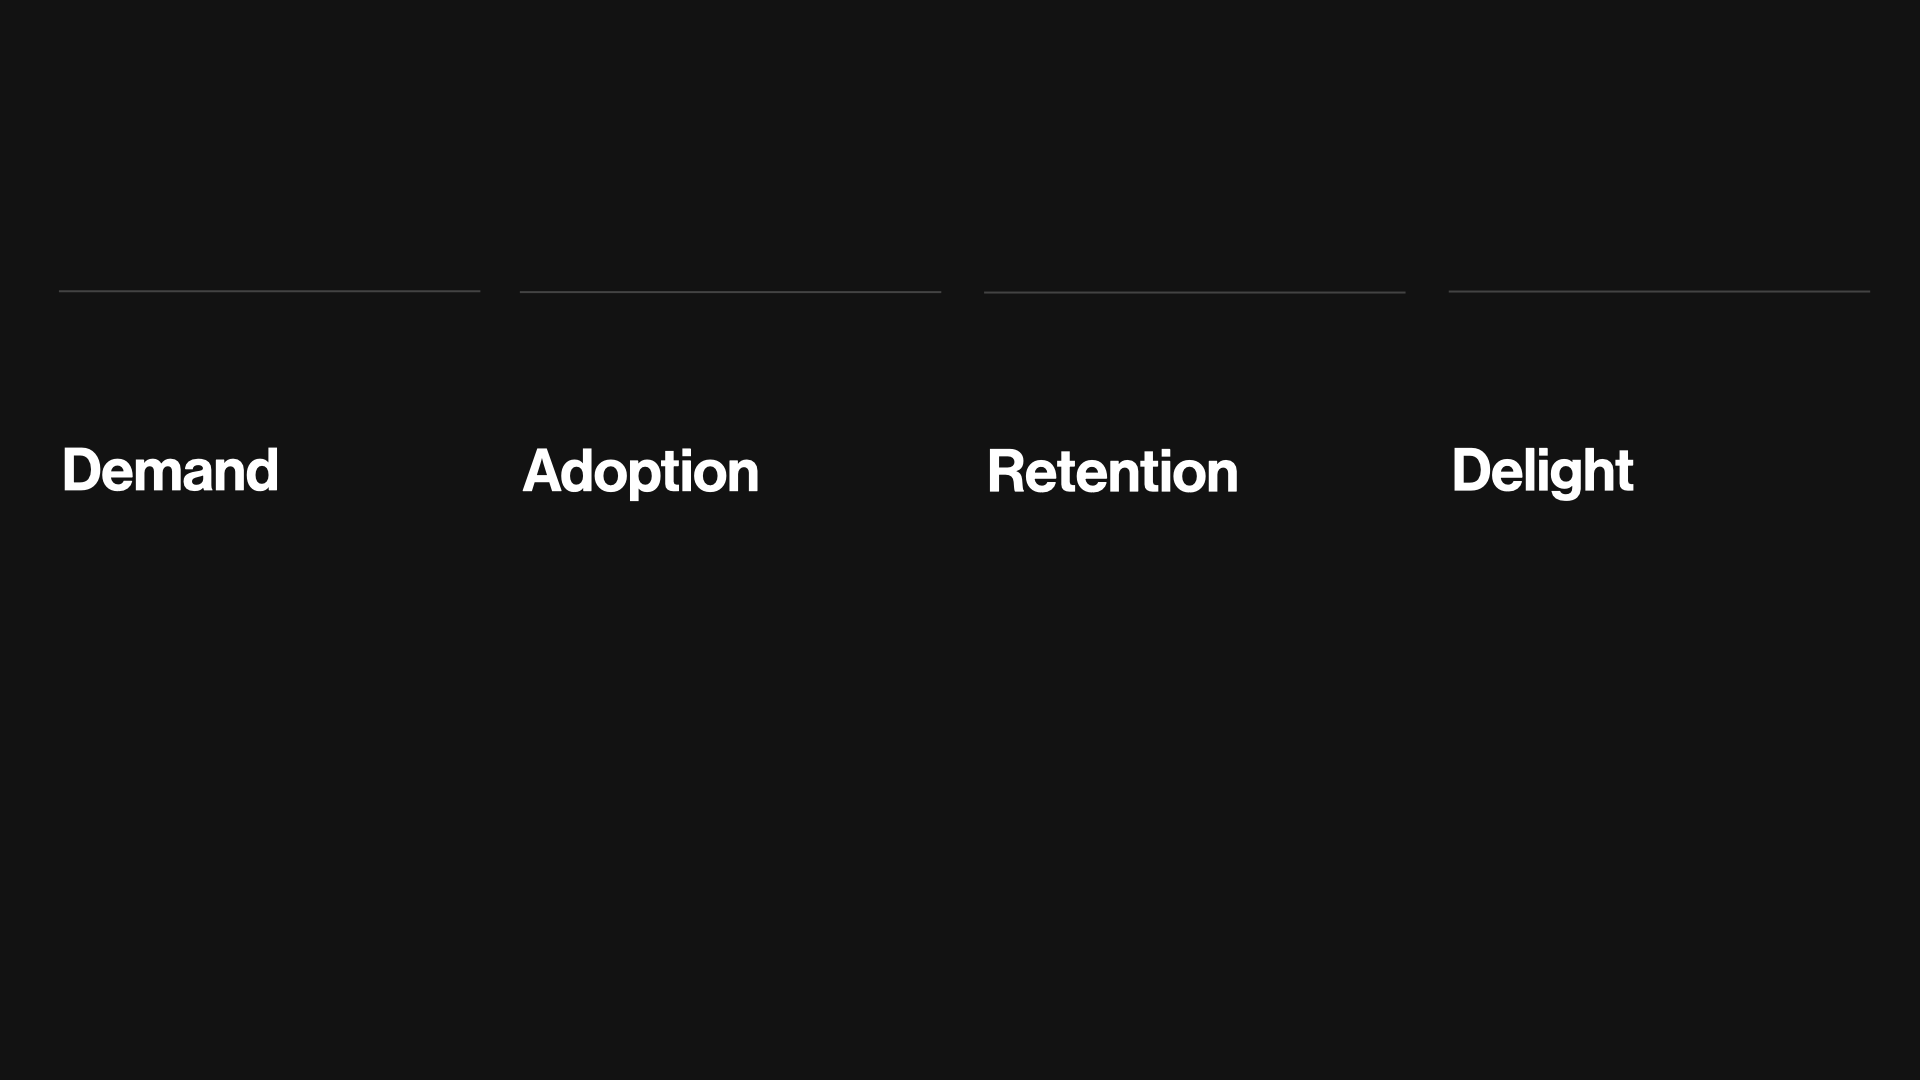
To make it easy to remember, I organized this into DARE, which is Demand, Adoption, Retention, and Delight, where I cheated with Delight and used the E for the acronym. My apologies for cheating, but now at least, you will remember DARE.
Here is a high-level overview of why this framing matters:
- Demand is simply the volume of people coming to your product
- Adoption is the people who discover and use the feature for the first time
- Retention is the population of people that use that feature multiple times
- Delight is the satisfaction with the product and the outcome it creates for them
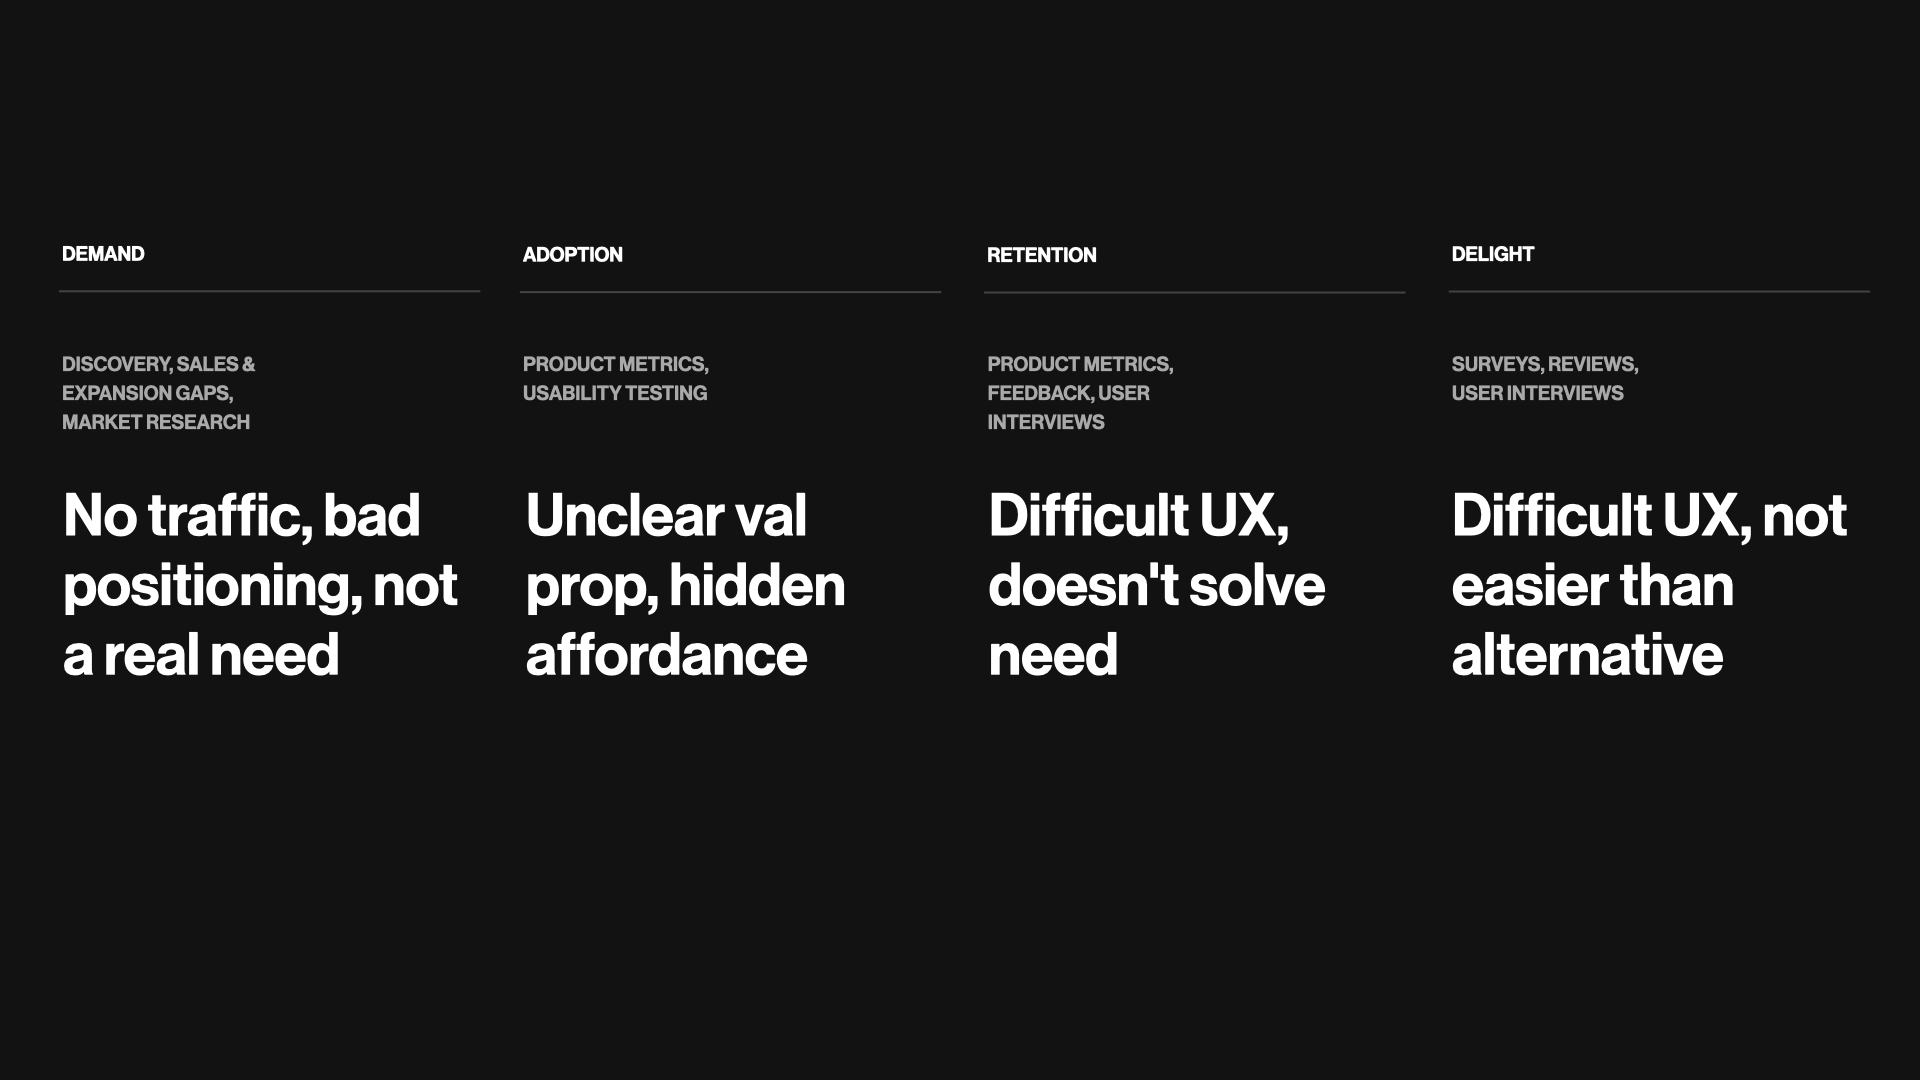
Let's take a look at the most common product problems. I'll combine the types of customer signals I mentioned previously and layer them over the four stages.
Solving Common Product Problems
Demand
With Demand, a lack of people coming to the product is often a sign that this is not a real problem – the target market is satisfied with the alternative solution they're currently using, so they are not searching for a product like yours – or, the positioning doesn't match the language of your target market, so they don't stumble upon what you have to offer, or there is some sort of distribution channel / product fit that is broken and preventing the right people from discovering your product. You likely will only notice this problem in the analytics – as an absence of traffic – and you'll have to talk to customers to debug the issue.
This is where user interviews and tools like the value proposition canvas will help you potentially re-align your product positioning to target the right customer – in their language.
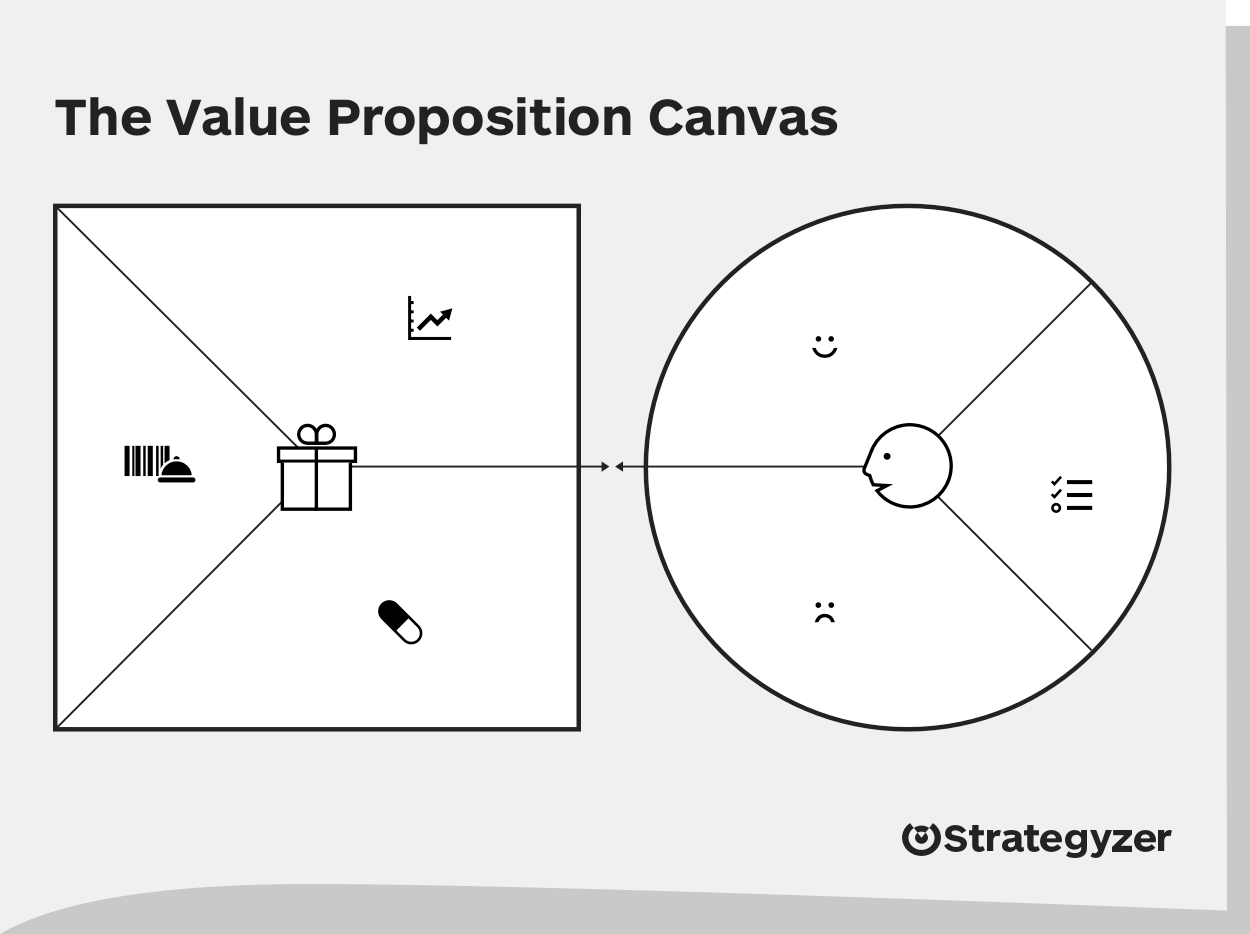
In fact, many startups pivot the product before they pivot their positioning or target customer. Changing copy is much easier than changing the product.
Once you nail demand and have a healthy flow of new people into your product, then it’s all about whether people understand and discover your feature.
Adoption
Common adoption problems stem from an unclear val prop, lack of a clear affordance to get started, targeting the wrong segment of users, or having a small target segment that is interested in the functionality but represents such a minority that it looks like no one uses the feature.
You can spot adoption issues by a low showing in product analytics. But over the years, I picked up the sense that the absence of feedback and reviews tends to correlate with a lack of adoption. When I'm not seeing feedback come in, my spider-sense starts to go off. As Bezos quipped (more on that later), customers are never truly satisfied, so if they're using the feature, they'll tell you how you can make it better for them.
A great way to debug issues is to talk to users that use the product but have not used the feature yet to help you understand why not – do they have a set habit or workflow, do they not know about it, do they not care?
Most features suffer from not enough real estate on the product surface area or a non-obvious affordance to get started. This is the perfect opportunity for a product designer to look at how to better present the entry-point into a new feature, or leverage something like coach marks to signal new functionality.
At Productboard, we learned that contextually signaling new features through coach marks increases adoption by at least an order of magnitude.
Once you nailed adoption, move on to solving retention problems.
Retention
Retention is all about being useful and usable. If you're both of these, people want to come back. How many times a day do we check apps like Instagram, or Whatsapp, or Slack?
Common retention problems stem from difficult UX, how well it solves the problem, how frequently the need occurs vs. expectations, or targeting the wrong segment of users.
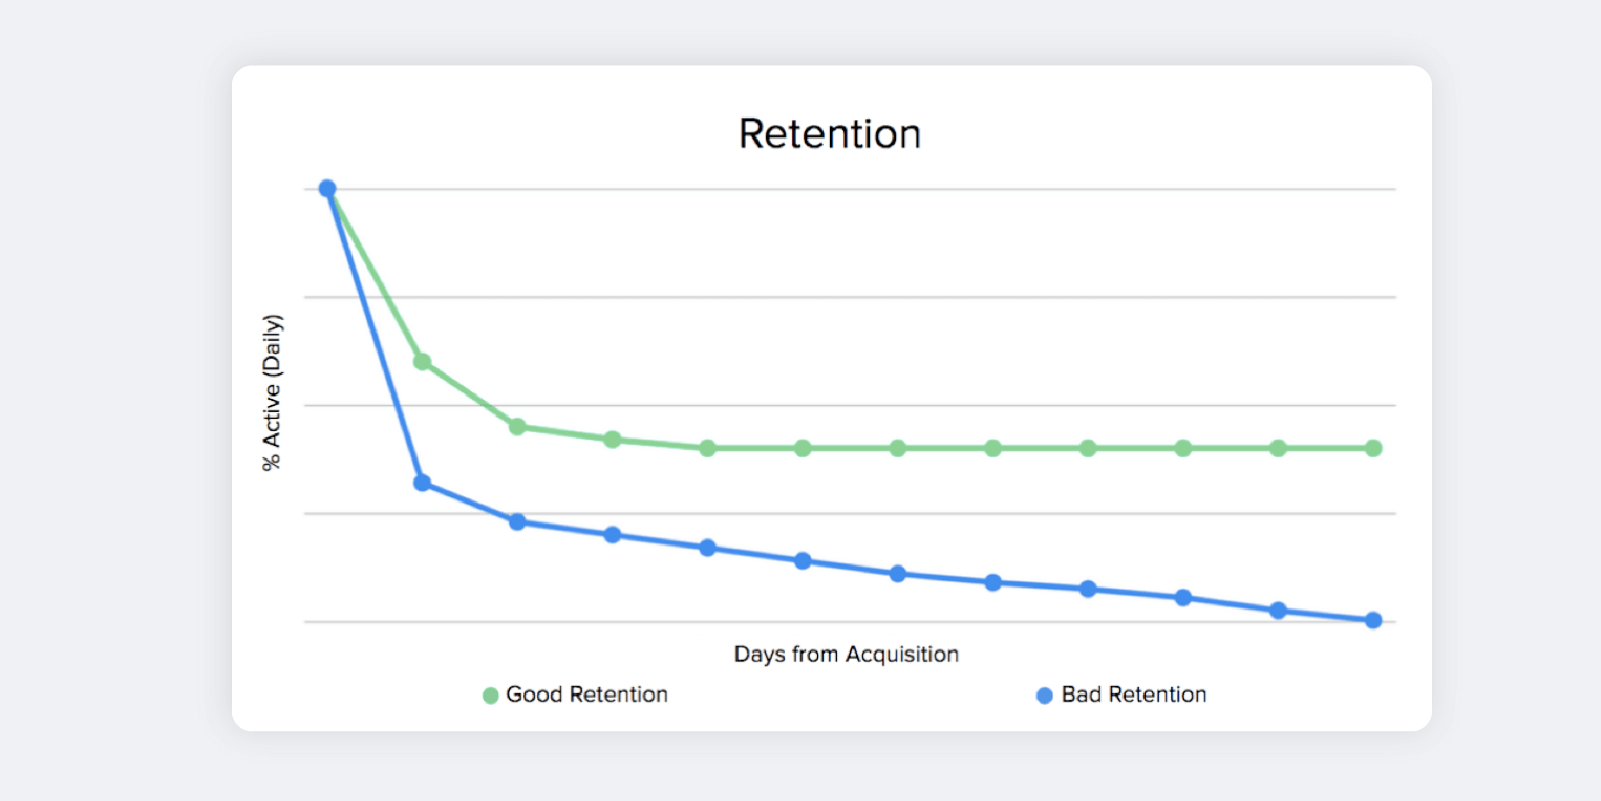
It's easy to spot bad vs. good retention in the metrics. Bad retention looks like a ski slope, while good retention slopes down and then plateaus as the product or feature finds PMF and the right people continue to use it.
You can spot potential retention issues in qualitative feedback as well. This tends to look like blocker statements – people want to use your feature, but they're actively telling you how it doesn't work for them.
A great way to debug retention issues is to look at the themes in feedback and interview users that only used it once or are proactively telling you that it's broken for them.
If it's hard to meet with people, it's a sign that it might be the wrong segment. Why would someone want to talk to you about something that is not important to them?
The right segment of users is happy to talk with you about how it's not working as they expected and how they wish it would work better. They have a real need for your product and feature, and they know you're close to being great for them.
Once new cohorts form happy retention plateaus, it's time to move on to delight.
Delight
Delight. I think this is the most debated and misunderstood job of the products we build. In the world of startups and disruptive innovation, the absence of delight in a category is typically the opportunity for innovation and changing the market completely. Many product teams forget this once their product is beyond 3-5 years old and leave themselves open to the next wave of innovators that will one day steal their lunch.
There are many advantages to a customer-centric approach, but here’s the big one: customers are always beautifully, wonderfully dissatisfied, even when they report being happy and business is great. Even when they don’t yet know it, customers want something better, and your desire to delight customers will drive you to invent on their behalf. No customer ever asked Amazon to create the Prime membership program, but it sure turns out they wanted it, and I could give you many such examples. – Jeff Bezos
So what exactly is delight? Gamification? Emojis? Confetti? It's a feeling, and it's highly qualitative, which confuses the data-driven people. But I believe you can measure and trend it as a quantitative proxy to help you know how things are going.
Every researcher I have worked with in my career likes to debate the validity of survey frameworks and which one is best.
5-point Likert scale.
PMF Survey.
CSAT Surveys.
NPS Surveys.
7-point Likert scale.
I am slightly agnostic of which one really matters for assessing delight, as long as you have a great question and an easy-to-understand scale. Delight looks like a plurality of anything that's not average – that's 4+ on CSAT, 80%+ on PMF, or an NPS above 60.
You want high scores.
And while NPS often gets a bad rap, think about the products you've heard about from friends – they tend to be pretty cool. Early startups live and die by word of mouth. NPS might be overrated in the C Suite, but it's underrated by the people building the products and services.
Common delight problems look like average to low scores on any of these surveys. And if you once had great scores, this is typically a sign that you are losing PMF as new segments of customers start to use your product or feature, but expect more – either you are missing functionality they want, or they are not willing to put up with the bugs or usability issues that your earlier segments overlook.
At Productboard, we not only capture satisfaction for features, but we sample and trend NPS on a quarterly basis. We do this because we care more about trending in the right direction than achieving any specific score or industry benchmark.
Once you have that high score, you have to continue inventing better features and products for your customers.
Today's delight is tomorrow's table stakes.
Bringing it all together
I covered a lot of ground, so I'll wrap this up and recap some of the concepts. If I leave you with only one idea, it's that relying on a single metric or technique blinds you to what is really happening with the people using your products.

There are many sources of customer insight, from the qualitative to the quantitative... from the small data to the big data. In total, they represent the best version of the truth about the people using our products, and they're all important for making great product decisions.
But not all customer insight is created equal. Some tell us how our customers behave. Some tell us what they wish we would have done better. Some tell us what we might want to build next to keep growing. And some deep-dive specific topics, providing a depth not found in any of the other categories.
All of these insights are important for debugging the common product problems that teams face – from demand to adoption to retention to delight.
Let's build great products that delight the people that use them.
Be curious.
Look at the data.
And always talk to the people using your product.
When the anecdotes and the metrics disagree, there's something wrong with the way you are measuring it. – Jeff Bezos
Reference Material
Frequently Asked Questions
What user research data to I need to to collect to understand my customers?
You should focus on collective a range of user research data that best represents your customers, their attitudes, and their behaviors. Here are some key types of user research data that can help you understand your customers:
- Behavioral data
This includes usage data, web/app analytics, etc. that shows how customers actually use your product. This reveals insights into their needs, pain points, and where they struggle. - Feedback data
Sources like surveys, reviews, support tickets, NPS, interviews, etc. provide direct customer input on their experience. This gives qualitative insights into satisfaction, desires, frustrations. - Market data
Research reports, competitive analysis, sales prospecting notes, etc. show what needs exist in your target market. This highlights opportunities for new features or products. - User testing data
Observing target users interact with prototypes, designs, or your product reveals usability issues and confusion points.
The key is to collect a combination of quantitative and qualitative data to get a complete picture. Some key principles:
- Track behavioral data over time to spot trends and changes.
- Regularly sample feedback data from a diverse set of users.
- Continually gather market data to stay on top of shifts.
- Proactively run user tests on new ideas and changes.
Focus on combining different sources of data to uncover the full story of your customers' needs and where the opportunities lie for your product. Work with your user experience research team to collect missing user research data. If you don't have a team, you will need to focus on gathering the most critical insights that will enable you to make decisions. Remove any collection of user research data that does not directly lead to the ability to make a better product or service. The goal is a 360-degree understanding of your users through your research data.
How do I clearly set up my research goals?
Here are some tips for setting clear goals and identifying key insights for your customer research:
- Start by defining the specific product or business questions you need to answer. This gives your research focus and purpose.
- Frame your questions around the key metrics or outcomes you want to improve - e.g. increase new user activation, reduce churn, increase engagement.
- Identify the user insights that will shed light on those goals. These may relate to awareness, comprehension, usability, utility, desirability, etc.
- Prioritize addressing the biggest risks and unknowns first. Where is understanding lacking the most?
- Consider both qualitative insights (thoughts, feelings, behaviors) and quantitative data (stats, metrics) that you need.
- Define the audience(s) and personas you want to understand better through the research.
- Determine appropriate sample sizes and research methods to gain sufficient, quality insights.
- Focus on discovering actionable findings that can directly inform decisions and changes.
Effective user research goals are precise, targeted, and connect to key product or business metrics. They frame the specific insights you seek about user behaviors, motivations, or preferences that can guide better solutions. Remember to keep your research goals as lean as possible. Focus on gathering fewer, but more impactful key insights. The end result should be clear direction for improving the customer experience.
What are the key steps in conducting user research that lead to valuable, key insights?
Conducting effective user experience research typically involves three main phases:
- Research planning
This involves determining your research goals, drafting research questions, selecting participants, and designing your research protocol. Develop clear goals and questions to guide your research. Recruit a representative set of users based on your target audience. Design sessions to gain the necessary feedback. - Research sessions
Moderate research sessions where users complete representative tasks and give feedback. Take comprehensive research notes and recordings during each session. Keep users focused while allowing for organic feedback. - Analysis and insights
Review your research notes, organize feedback by theme, analyze results across users, and synthesize key insights. Identify patterns and actionable outcomes. Focus on the most impactful, valuable insights that address your original research questions. Save all notes, but present valuable insights to the broader team.
Following this process will provide you with insights into your users' motivations, pain points, and desires. These evidence-based insights pave the way for design improvements that enhance user experience. Ongoing research is key to continue iterating and evolving product design over time.
What are synthesis best practices for design teams without dedicated user researchers?
The synthesis process is where you will start to find patterns in the data. Group findings as a first step in creating a short list of insights. Start my organizing interviews by session dates, then continue to refine based on themes or topics that emerge across dates. Post-it notes work great, but if you're a digital organization or distributed, you're going to want to move it to a digital format for team members to collaborate with you. Miro is a great to for quickly creating clusters to find patterns and share notes with your team.
You will need a way to organize your data. All this data is great, but if no one can find it in the future it won't help the design team make great decisions in the future. The best design teams use tools like Dovetail to capture insights and avoid using gut feeling.